False bottom
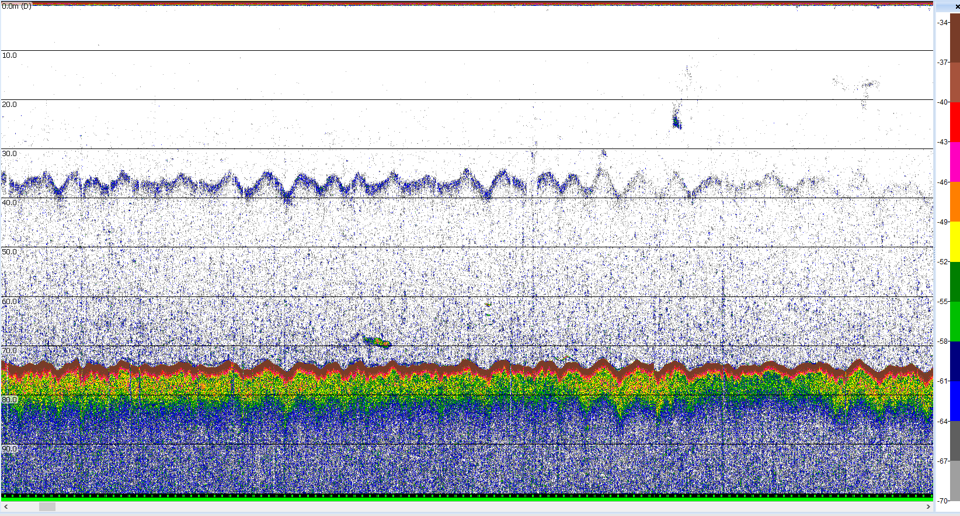
Figure 1. 120 kHz Simrad Ex60 data (Rhian Evans/IMAS), false bottom at ~ 38 m.
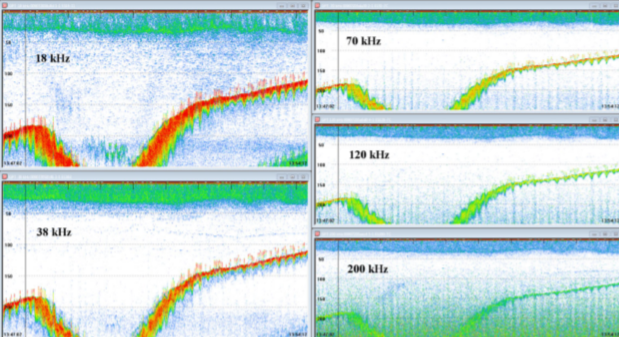
Figure 2. Renfree and Demer 2016. "Figure 2. Echograms at 18, 38, 70, 120, and 200 kHz (top to bottom, from left to right) showing an aliased seabed echo (“false bottom”), characteristically decreasing in intensity with increasing frequency. Levels, light to dark, correspond to SV from 270 to 234 dB. This figure is available in black and white in print and in color at ICES Journal of Marine Science online."
Renfree and Demer investigated the optimization of transmit interval and logging range while avoiding aliased (false) seabed echoes. They used ER60 Adaptive Logger software to avoid false bottom echoes and improve data quality.
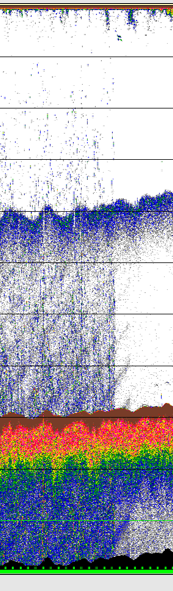
Figure 3. 120 kHz Simrad Ex60 data (Rhian Evans/IMAS), intermittent noise and false bottom.