About echograms
An echogram is a visual representation of an acoustic variable. It is the principal window for quality control, editing and analysis of data. Refer to Using Echoview: Key concepts for information about ways to handle the data in echograms.
This page covers:
Displaying an Echogram
To display an echogram, do one of the following:
- On the View
menu, point to Echogram, and
then click a variable.
Note: If you have created multiple filesets or virtual variables you will have to point to the fileset that contains the variable after pointing to Echogram. - On the Filesets window; double-click an acoustic variable, or select a variable and click Echogram.
- On the Dataflow window; double-click an acoustic variable icon, or right-click on an acoustic variable icon then click Echogram.
Notes:
- To view more than one window of the same echogram, hold down the CTRL key while opening the next instance of the echogram.
- The 4D window can display georeferenced samples in time and may be available to selected variables.
- The scene window can display echogram curtains.
- See also Echogram information
- Export to Image
- Copy to clipboard
Types of Echogram
Echoview supports three basic types of a echogram.
Echogram type |
Description |
Single beam |
Displayed for variables derived from single beam, split beam and dual beam data (and individual beams from multibeam data). These echograms show a grid of data points with one ping after another from left to right, and one data point under another from top to bottom. Range from the transducer is measured top to bottom and time is measured left to right. For information about specific types of single beam echograms, see single beam echograms (below). |
Multibeam |
Displayed for variables derived from multibeam data. These echograms show all beams for a single ping in the form of a sector plot. Beams are displayed from left to right, and one data point under another along each beam axis. A sector plot only displays data from a single ping but sector plots may be viewed (replayed) in order to view data across multiple pings. For information about specific types of multibeam echograms, see multibeam echograms (below). |
Virtual |
Echograms created in Echoview using the Dataflow window. This term is used to distinguish echograms of virtual variables from those of raw variables. You can create virtual single beam or virtual multibeam echograms if the appropriate raw data is available form which the virtual variables can be created. |
Single beam echograms
Echoview supports the following types of single beam echograms:
- Sv echogram
- TS echogram
- Angular position
- Power
- Complex angular position
- Complex power
- Complex Sv
- Complex TS
- Single targets
- Target length
- Unspecified dB
- Linear
- Color
- Boolean
- Current velocity
Note: The data type of the variable being displayed determines what type of echogram is displayed.
Sv echogram |
|
|
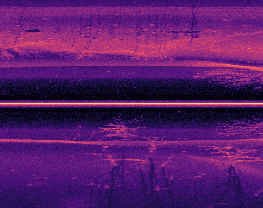
Each data point on a Sv echogram represents a Volume backscattering coefficient measured in decibels referenced to 1 m2/m3. Each data point is displayed in a color determined by the selected color scheme. The Sv value may be read directly from the data file in some instances or calculated by Echoview from received power data stored in the data file. It is possible to integrate Sv data. Indeed Sv data are considered by many to have meaning only when they are integrated. See also: Understanding echograms |
TS echogram |
|
|
Each data point on a TS echogram represents a Target Strength measured in decibels referenced to 1 m2. Each data point is displayed in a color determined by the selected color scheme. The TS value may be read directly from the data file in some instances or calculated by Echoview from received power data stored in the data file. See also: Understanding echograms |
Angular position echogram |
|
|
Each data point on an angular position echogram represents a position within the transducer beam, measured by a pair of angles, one in the direction of the minor axis, and the other in the direction of the major axis of the transducer. Each data point is displayed in a color determined by the combination of two selected color schemes, one for the minor axis and one for the major axis. Angular position echograms are distinct from ordinary echograms in that each data point represents two values (a minor axis angle and a major axis angle). The color scheme none may be selected for one or the other angle to hide it from the echogram display. The displayed color will then be a function of the other angle only. This is useful when only one direction is of primary interest (upstream/downstream for example). Onscreen the angular position values are reported as Minor axis: Major axis. See also: Understanding echograms |
Power echogram |
|
|
Each data point on a power echogram represents the received power modified by the system transmit and receive constants in decibels referenced to 1W. Each data point is displayed in a color determined by the selected color scheme. Power may be read directly from the data file in some instances or calculated using the received power data stored in the data file. Power can be used in echosounder algorithms to calculate Sv and TS data. See also: Understanding echograms, EK60 Power to Sv to TS |
Complex angular position echogram |
|
|
Each data point on a complex angular position echogram represents a pair of angles (in degrees) where the transmit pulse is frequency modulated. Each data point represents a position within the transducer beam, measured by a pair of angles, one in the direction of the minor axis, and the other in the direction of the major axis of the transducer. Each data point is displayed in a color determined by the combination of two selected color schemes, one for the minor axis and one for the major axis. Angular position echograms are distinct from ordinary echograms in that each data point represents two values (a minor axis angle and a major axis angle). The color scheme none may be selected for one or the other angle to hide it from the echogram display. The displayed color will then be a function of the other angle only. This is useful when only one direction is of primary interest (upstream/downstream for example). Complex angular position is calculated from data read from file. Complex angular position data can be pulse compressed. Such data is of a data type named pulse compressed complex angular position. Onscreen the angular position values are reported as Minor axis: Major axis. See also: Understanding echograms. |
Complex power echogram |
|
|
Each data point on a complex power echogram represents a complex power value in decibels referenced to 1W. Complex power is recorded for echoes where the transmit pulse is frequency modulated. Power values are a result of the received power modified by the system transmit and receive constants. Power can be used in echosounder algorithms to calculate Sv and TS data. Each data point is displayed in a color determined by the selected color scheme. Complex power may be read directly from the data file. Complex power data can be pulse compressed. Such data is of a data type named pulse compressed complex power. See also: Understanding echograms, EK80 Power to Sv and TS. |
Complex Sv echogram |
|
|
Each data point on a complex Sv echogram represents a complex Sv value in decibels referenced to 1m2. Each data point is displayed in a color determined by the selected color scheme. Complex Sv is calculated with an Sv echosounder algorithm developed for complex power. Complex Sv data can be pulse compressed. Such data is of a data type named pulse compressed complex Sv. See also: Understanding echograms |
Complex TS echogram |
|
|
Each data point on a complex TS echogram represents a complex TS value in decibels referenced to 1m2. Each data point is displayed in a color determined by the selected color scheme. Complex TS is calculated with a TS echosounder algorithm developed for complex power. Complex TS data can be pulse compressed. Such data is of a data type named pulse compressed complex TS. See also: Understanding echograms |
Single targets echogram |
|
|
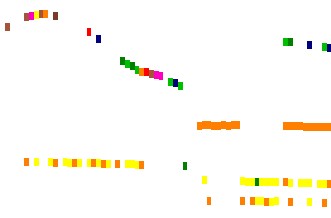
Single targets echograms are distinct from ordinary echograms in that they do not consist of a grid of data points. Pings are displayed left to right as usual, but each single target in the data file (or detected by Echoview) is displayed at its depth (target_on_axis_depth not target_true_depth) or range with a target strength as a TS value. Two single targets may overlap on the display (depending upon the selected display thickness). Each target is displayed in a color determined by its Target Strength (on single target echograms) and the selected color scheme. Note: A single target echogram can display the single targets of a raw variable or single targets detected with a single target detection operator. See also: Understanding echograms
|
Target length echogram |
|
|
Target length echograms are distinct from ordinary echograms in that they do not consist of a grid of data points. Pings are displayed left to right as usual, but each single target variable (target length) detected by Echoview is displayed at its depth (target_on_axis_depth not target_true_depth) or range. Two single targets may overlap on the display (depending upon the selected display thickness). Each target is displayed in a color determined by its target length (on target length echograms) and the selected color scheme. See also: Understanding echograms |
Unspecified dB echogram |
|
|
Each data point on an Unspecified dB echogram represents a value in decibels with an unknown reference. Each data point is displayed in a color determined by the selected color scheme. Unspecified dB echograms are typically virtual echograms produced by some operators in the Advanced Operators module. See also: Understanding echograms |
Unspecified dB Sidescan echogram |
|
 |
This echogram is only suitable for visualization. Sidescan/side-scan data is the recorded echo intensity returned by a sidescan transducer. The displayed unspecified dB data represents an map-like image over a wide area each side of the vessel or platform. Each data point has an unspecified dB value with a range and depth specific to a side (Left or Right) of the sidescan transducer(s). The echogram displays both data sides simultaneously and results in data points on one side with positive range and depth and data points on the other side with negative range and depth. Echoview may derive (subsequent) Sidescan Left and Sidescan Right variables where the data point range and depth is positive. The Sidescan Left and Sidescan Right echograms can be handled like unspecified dB echograms. See also: Navico Group Lowrance data, Understanding echograms |
Unspecified dB - Join opposing pings echogram |
This echogram is only suitable for visualization. A Join opposing pings echogram displays data output by the Join opposing pings operator. Samples from operand 1 and 2 are displayed simultaneously in relation to the transducer geometry and sample thickness of operand 1. As a result the echogram displays both positive and negative ranges, but positive depths. See also: Scenario: Moving glider or AUV with a transducer pointed up and a transducer pointed down |
Linear echogram |
|
|
Each data point on a Linear echogram represents a value in unspecified (linear) units. Each data point is displayed in a color determined by the selected color scheme. Linear echograms are typically virtual echograms produced by some operators in the Advanced Operators module. See also: Understanding echograms |
Color echogram |
|
|
Each data point on a Color echogram represents a red, a green and a blue color component. Each data point is displayed in the color specified by the red, green and blue components of the data. Color echograms are typically virtual echograms produced by some operators in the virtual echogram module. In virtual echograms where there is only one input operand, No_data values are represented by the color scheme of the input operand, on the Display page of the Variable Properties dialog box. In virtual echograms where there are multiple operands, No_data values are represented by the color scheme of the virtual variable, on the Display page of the Variable Properties dialog box. See also: Understanding echograms |
Boolean echogram |
|
|
Each data point on a Boolean echogram represents a true or false value. Each data point is displayed in a color determined by the selected color scheme. The two extreme colors on the chosen scale will usually be used, one for true, the other for false. Boolean echograms are virtual echograms produced by some operators in the Advanced Operators module. They are typically useful as operands for other operators and used to mask areas of other echograms according to the criteria used in their creation. See also: Understanding echograms |
Current velocity echogram |
|
|
Each data point on a Current velocity echogram represents a current velocity in millimeters per second. Each data point is displayed in a color determined by the selected color scheme. Any one current velocity echogram displays the current velocity in one direction only, according to the variable being displayed. Such data are available from ADCP devices. See also: Understanding echograms |


Multibeam echograms
Echoview supports the following types of multibeam echograms:
Notes:
- The data type of the variable being displayed determines what type of echogram is displayed.
- A 4D window may also be available to a multibeam acoustic variables. The 4D window displays georeferenced samples in time and may be used in tandem with the matching echogram.
Multibeam angular position echogram

Each data point on an angular position pings formed beams echogram represents the mean of angular position values that contribute to a pixel. The beam geometry of the angular position pings formed beams variable follows that of the multibeam Sv variable.
An angular position pings formed beams variable is derived from Simrad ME70 data.
See also: Understanding echograms and About multibeam echograms
Multibeam magnitude echogram |
|
|
Multibeam magnitude echograms display the magnitude of the received signal in unspecified linear units. See also: Understanding echograms and About multibeam echograms |
Multibeam Sv echogram |
|
|
Each data point on a Sv echogram represents a Volume backscattering coefficient measured in decibels referenced to 1 m2/m3. Each data point is displayed in a color determined by the selected color scheme. Multibeam Sv values are calculated from signal magnitudes stored in multibeam data files. See also: Understanding echograms and About multibeam echograms |
Multibeam TS echogram |
|
|
Each data point on a TS echogram represents a Target Strength measured in decibels referenced to 1 m2. Each data point is displayed in a color determined by the selected color scheme. See also: Understanding echograms and About multibeam echograms |
Multibeam phase echogram |
|
|
Multibeam phase echograms display the phase of the received signal in radians. See also: Understanding echograms and About multibeam echograms |
Multibeam targets echogram |
|
|
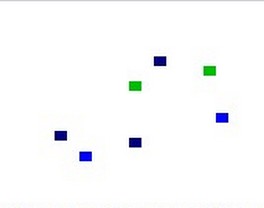
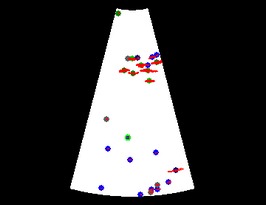
Each circle on a multibeam targets echogram represents an individual target. The circles are positioned at the geometric center of the data points that make up the target. The color of the circle is based on the mean Sv value of the all data points that make up the target. The size of the circle is fixed and is not proportional to the size of the target. Targets with manual length measurements have a colored outline that is distinct from targets without manual measurements. Such a target is shown in the lower third of the displayed echogram. Targets manually assigned to a target class are displayed with the class label. You can view the samples that contribute to the target (in each beam) via the settings on the Display page of the Variable Properties dialog box. Multibeam targets echograms are typically virtual echograms produced by some operators in the Multibeam Fish Tracking module. See also: Understanding echograms and About multibeam echograms and Target properties from multibeam data. |
Multibeam unspecified dB echogram |
|
|
Each data point on an Unspecified dB echogram represents a value in decibels with an unknown reference. Each data point is displayed in a color determined by the selected color scheme. Unspecified dB echograms are typically virtual echograms produced by some operators in the Multibeam Fish Tracking module. See also: Understanding echograms and About multibeam echograms |
Multibeam boolean echogram |
|
|
Each data point a Multibeam boolean echogram represents a true or false value. Each data point is displayed in a color determined by the selected color scheme, although only the two extreme colors on the chosen scale will be used, one for true, the other for false. Multibeam boolean echograms are virtual echograms produced by some operators in the Advanced Operators module. They are typically useful as operands for other operators and used to mask areas of other echograms according to the criteria used in their creation. See also: Understanding echograms and About multibeam echograms |
Multibeam color echogram |
|
|
Each data point on a multibeam color echogram represents a red, a green and a blue color component. Each data point is displayed in the color specified by the red, green and blue components of the data.
Multibeam color echograms are typically virtual echograms produced by some operators in the Advanced Operators module. See also: Understanding echograms and About multibeam echograms |
See also
About viewing data
Understanding echograms
About multibeam echograms
Echogram keyboard shortcuts
Echogram navigation: Auto-synchronization
Echogram navigation: Mouse pointer duplication
Echoview Information toolbar
Echoview Status bar
Using Echoview: Key concepts
Echogram interpretation
Virtual variable applications
4D window