Time-varied threshold
Data can be thresholded using a threshold function (TVT or time-varied threshold) that is dependent on range from the transducer. For an Sv variable the function of range is of the same form as a "20log(r)" time-varied gain (TVG) function and for a TS variable it is of the same form as a "40log(r)" time-varied gain (TVG) function.
See also: Time-varied threshold on the Data page of the Variable Properties dialog box.
For Sv variables
TVT(r) = Sv(1) + 20log(r) + 2 (r-1)
(r-1)
Where:
Sv(1) is volume backscattering strength at one meter range as specified on the Data page of the Variable Properties dialog box (dB re 1m-1).
r is the range or corrected range from the transducer (m)
is the absorption co-efficient (m-1). Note that for Simrad EK80 data the absorption coefficient is calculated using the Francois and Garrison equation.
The threshold function used for a ping is:
Sv'(r) = Sv(r) if Sv(r) > TVT(r)
-999 if Sv(r) <= TVT(r)
For TS variables
TVT(r) = TS(1) + 40log(r) + 2(r-1)
Where:
TS(1) is point backscattering strength at one meter range as specified on the Data page of the Variable Properties dialog box (dB re 1m2).
r is the range or corrected range from the transducer (m)
is the absorption co-efficient (m-1). Note that for Simrad EK80 data the absorption coefficient is calculated using the Francois and Garrison equation.
The threshold function used for a ping is:
TS'(r) = TS(r) if TS(r) > TVT(r)
-999 if TS(r) <= TVT(r)
Illustrated example
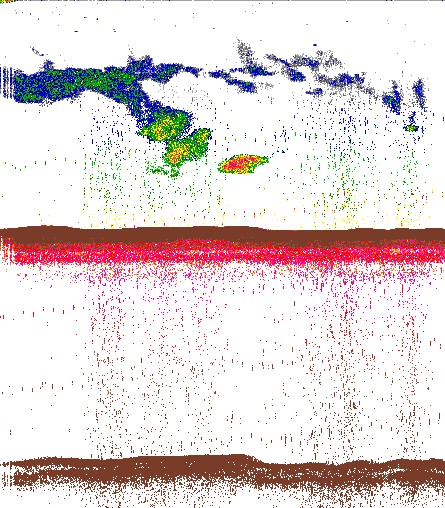
The following three Sv echograms, using the EK500 color scheme, display the effects of noise amplified by a time-varied gain and the application of a time-varied threshold:
|
Received Signal |
Noise signal with TVG applied |
Received signal with TVT applied |
|
|
|
|
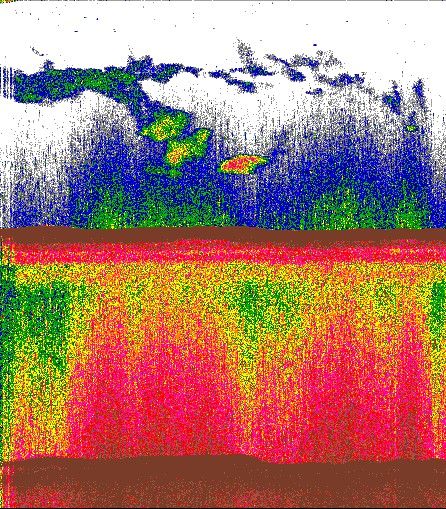

The value of "-150 dB at 1m" was arrived at by examining the signal in clear water, which is known to be recording noise, and fitting a TVG curve through it as illustrated below:
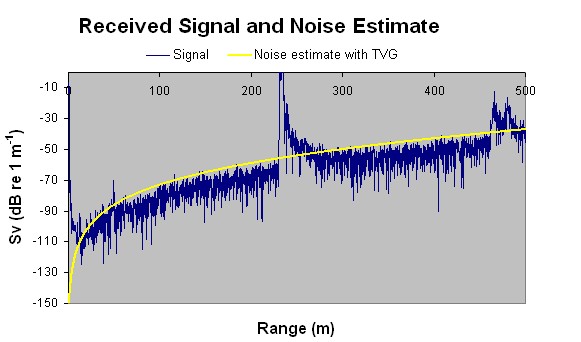
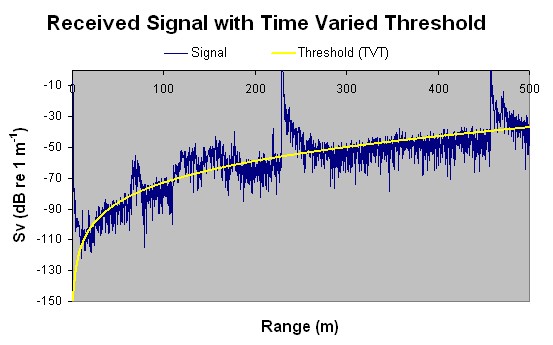
The bottom echo trace is clearly visible at ~220m range. A noise estimation is made as -150 dB at 1m from the transducer from these data. Pure noise of this intensity would produce the middle of the three echograms illustrated above. If this is used as a threshold curve the noise is effectively removed from the signal. Below is illustrated a ping from the middle of this sample echogram in which schools are clearly visible as the those regions above the threshold curve:
The noise estimate is arrived at by selecting an Sv value from a ping graph which is deemed representative of the noise level, noting its range, and applying the TVT formula above in reverse (with a known absorption coefficient) to determine the value of Sv(1).