dB difference Z score technique
| Loading and viewing > Calibration > Background noise-removal > Detection and filtering > Classification > Characterization |
The Z-score technique as described by De Robertis, McKelvey and Ressler (2010) is a type of dB difference classification.
Scenario - From processing intent to operators
De Robertis, A., McKelvey, D. R., and Ressler, P. H. 2010. Development and application of an empirical multifrequency method for backscatter classification. Can. J. Fish. Aquat. Sci. 67:1459-1474.
Abstract: We evaluated the feasibility of identifying major acoustic scatters in North Pacific ecosystems based on empirical measurements of relative frequency response. Acoustic measurements in areas where trawl catches were dominated by single taxa indicated that it might be possible to discern among key groups of scatterers such as fish with gas-filled swimbladders, euphausiids, myctophids, and jellyfish. To establish if walleye pollock (Theragra chalcogramma), a key species in the ecosystem, can be separated reliably from other groups under prevailing conditions, we developed a method based on the normal deviate (or Z score) to identify backscatter consistent with the pollock relative frequency response. We evaluated the performance of the method by comparing it with the traditional method of species identification (i.e., directed trawl catches and subjective interpretation of echograms) during five large-scale acoustic surveys of the eastern Bering Sea. Pollock abundance estimates employing the multifrequency method were highly correlated with those using the traditional method, which indicates that the multifrequency method performs well in this situation. In this environment, multifrequency methods will allow more inferences to be drawn when direct sampling of organisms is limited and will also complement existing abundance surveys by improving species classification and providing information about key non-target species.
The authors have kindly provided this paper and the associated data and EV file to use with Echoview's Introduction to the Formula operator tutorial.
|
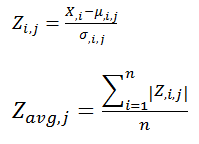
The Normal deviate equations for the Z score technique.
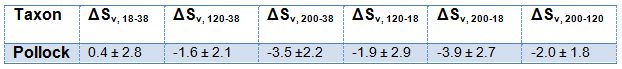
The Formula operator is used to calculate a normal deviate analysis for four frequencies (n = 6 pair-differences) where i is the frequency pair and j is the backscatter (species) class. Estimated values for µ and σ are used. Formula operators implement these equations in relation to the Pollock and Krill frequency response. Using the Zi,j values for Pollock. Tabulated values from the paper, “Table 2. Summary of ΔSv, statistics measured by taxon.”
The Pollack Z score expression is:
|
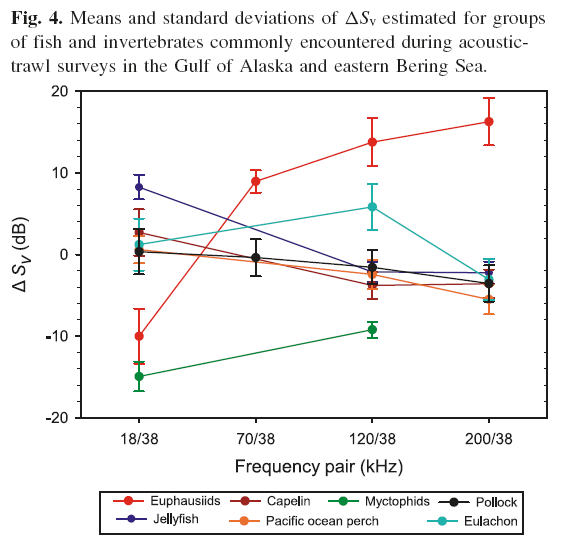
(Above) Screenshot of the frequency response graph from De Robertis, A., McKelvey, D. R., and Ressler, P. H. (2010). |
Dataflows
Stages of computation
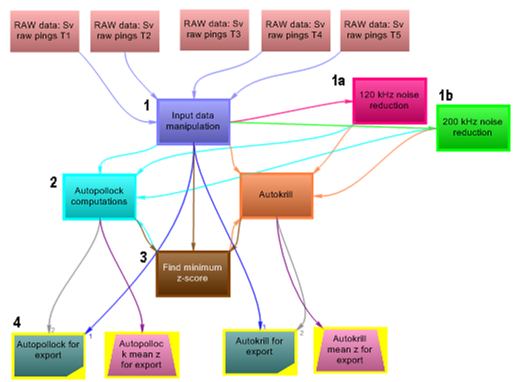 |
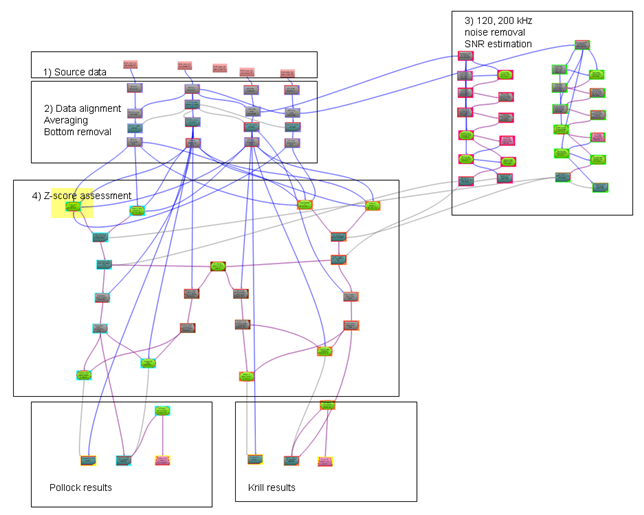
(Left) The numbered dataflow stages indicate grouped operators. The following table provides more information about the stages related to Pollock analysis.
*The Background noise removal operator estimates and removes background noise in one step.
|
Z score computation
|
(Below) The complete data flow for four frequencies. Dataflow objects are grouped (as labeled) in slightly different conceptual stages. The highlighted operator expresses the Pollack Zi,j equation. This dataflow is available in the Introduction to the Formula operator tutorial.
|