Fish aggregations

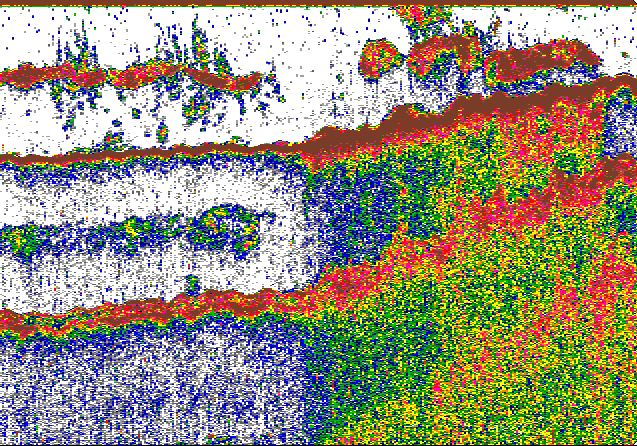
Figure 1: Fish aggregations (schools). Visible are second and third bottom echoes, also visible are the second echoes from schools.
See also
Examples of echogram interpretation

Figure 1: Fish aggregations (schools). Visible are second and third bottom echoes, also visible are the second echoes from schools.
Examples of echogram interpretation