About transmitted pulses
Hydroacoustic instrument systems transmit a continuous wave1 (CW) pulse and/or a frequency modulated (FM) pulse2. The echo that is received is processed and recorded as a ping that can be displayed in an echogram.
A single frequency transmit pulse can also be called a continuous wave pulse. It has a transmitted pulse duration, a single frequency and constant amplitude. The processing and acoustic methods for the single frequency echo are well established. For example, single beam echosounder algorithms for acoustic variables of Sv, TS data types are documented for BioSonics, and Simrad instruments and ping data may be displayed in Sv and TS echograms.
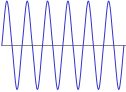
Figure 1: A constant amplitude single frequency pulse based on sin(x). The vertical axis is in amplitude units (centered on zero) and the horizontal axis is in time units.
A common type of frequency modulated transmit pulse is a chirp. A chirp has a transmitted pulse duration, an amplitude and contains a band of frequencies that change with time. The received echo contains data in the time domain and frequency data in the frequency domain. The acoustic calibration methods for commercial instruments that transmit chirps are in current active development. Ping data can be represented by acoustic variables of data type complex power, complex Sv, complex TS and complex angular position that may be displayed in complex power, complex Sv, complex TS and complex angular position echograms.
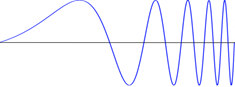
Figure 2: Linear chirp3. a constant amplitude sinusoidal pulse that increases in frequency at a linear rate. The vertical axis is in amplitude units (centered on zero) and the horizontal axis is in time units.
In frequency modulation, each part of the pulse has a unique frequency and received echoes with overlapping noise can be separated4,5 using signal processing mathematics. For objects in the water column that may have a frequency response6,7, the information from frequency modulated data could be used to uniquely identify and characterize an object.
|
|
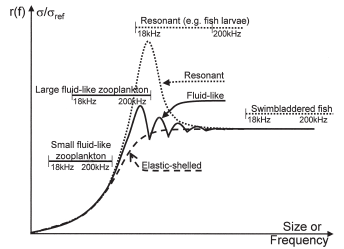
| Figure 3: Frequency response schematic from Korneluissen and Ona6. "A general schematic description of the relative frequency response, r(f). Bands indicate typical positions of selected acoustic categories when measured at frequencies 18-200 kHz." |
Pulse compression4 is a signal processing technique used in radar and sonar to increase the range resolution as well as the signal to noise ratio (SNR). The technique8 in effect offers the benefits of the high energy of a long pulse (increased range) and the high resolution of a short pulse (increased SNR) from a low power transmitter. This is achieved by modulating the transmitted pulse and then correlating the received echoes with the transmitted pulse. Without pulse compression a high power transmitter is needed to achieve both high range resolution and high SNR8.
Frequency modulation and pulse compression techniques allow you to acquire concurrent frequency response data with a single transducer. Standard methods for the calibration of frequency modulated instrument systems are in active development. The potential for pulsed compressed complex Sv and complex TS single beam data is that more information may be gained than that from single frequency single beam Sv and TS data. Particularly, with respect to:
- A frequency spectrum.
- Improved signal to noise ratio.
- Longer range8. This due to improved signal to noise ratio and a generally longer frequency modulated pulse duration (more energy).
- Improved resolution of overlapping echoes8. This is due to the improved signal to noise ratio combined with the frequency spectrum, where frequencies may be less noisy than others.
Chirp data and advanced signal processing
When the transmit pulse is frequency modulated, echoes may be recorded in complex number notation. Pulse compression methods can isolate and further enhance echo data and Fourier analysis10 mathematics that can find the frequency spectrum of a time signal.
Some instrument systems are able to transmit different chirps. The recorded echo data can cover “wideband” bandwidths11 whose start and stop frequency are based on the chirp’s frequency bandwidth and digital processing mathematics e.g. echo data may be recorded for bandwidths of 45-90 kHz, 90-160 kHz and 160-260 kHz.
Complex power, complex Sv, complex TS and complex angular position ping data represent the echo where the transmit pulse is frequency modulated.
Pulse compressed complex power, pulse compressed complex Sv, pulse compressed complex TS and pulse compressed complex angular position represent the echo correlated with the frequency modulated transmit pulse. Pulse compression uses a matched filter convolution to achieve a higher SNR for the frequency modulated echo. The pulse compression stage introduces a range offset that is based on the size of the matched filter and the start range for the physical target. The reasoning for the start range offset is similar to that applied to single target data. The Single target detection - wideband operator applies an accepted range offset to place targets at the start of the pulse compressed single target echo.
Note on nominal frequency: In Echoview, nominal frequency is automatically added to the transducer object on the dataflow as part of dynamic naming. It is important to understand that nominal frequency, which is read from the data file and not manually set, differs from the frequency range (start and end frequencies). Unlike an average or median, nominal frequency is a specific characteristic defined by transceiver specifications and can vary across different wideband hardware. This distinction is critical as it is not representative of the full range of frequencies that may appear in wideband data.
In Echoview, frequency response data for a selection or region is displayed by and exported from a Wideband Frequency Response graph.
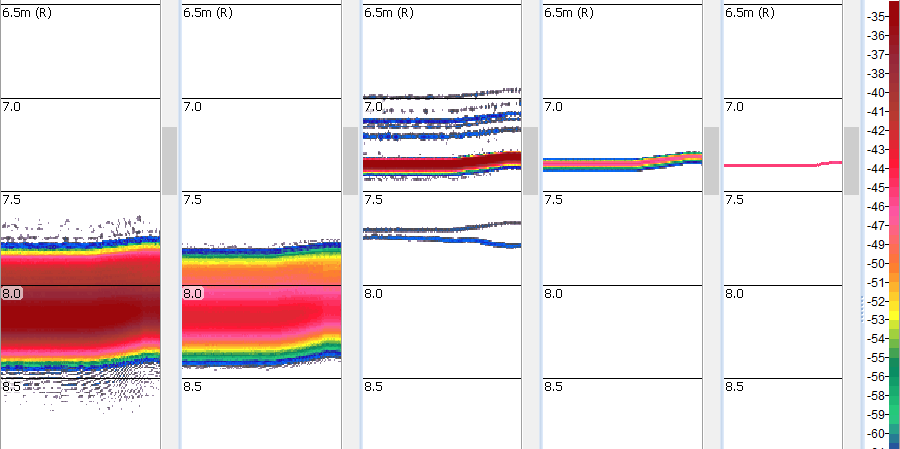
Figure 4: Simrad EK80 frequency modulated echogram data for a calibration sphere.
The echograms in Figure 4 display data (left to right) as follows: Sv wideband, TS wideband, Sv pulse compressed wideband, TS pulse compressed wideband, Single target detection - wideband. The transmitted pulse duration is 1.024 ms and speed of sound is 1491.44 m/s, they are used to calculate the start range offset under pulse compression.
Note: See also Wideband frequency response graph: Degraded response note associated with using no data, bad data/empty water regions and thresholding.
- https://en.wikipedia.org/wiki/Continuous_wave
- https://en.wikipedia.org/wiki/Chirp
- Georg-Johann (Own work) [CC-BY-SA-3.0 (http://creativecommons.org/licenses/by-sa/3.0) or GFDL (http://www.gnu.org/licenses/fdl-1.3.html], via Wikimedia Commons
- https://en.wikipedia.org/wiki/Pulse_compression
- Christian Wolff, http://www.radartutorial.eu/08.transmitters/Intrapulse%20Modulation.en.html
- Korneliussen R. and Ona E (2003) Synthetic echograms generated from relative frequency response. ICES Journal of Marine Science, 60:636-640
- Simmonds and MacLennan Second edition: Acoustic instruments. Section 3.5 Wideband systems. p99
- Chris Allen 2004, http://www.ittc.ku.edu/workshops/Summer2004Lectures/Radar_Pulse_Compression.pdf
- http://www.ittc.ku.edu/workshops/Summer2004Lectures/Radar_Pulse_Compression.pdf
- https://betterexplained.com/articles/an-interactive-guide-to-the-fourier-transform/
- https://en.wikipedia.org/wiki/Bandwidth_%28signal_processing%29
See also
About wideband data processing
Supported sonars and echosounders
Simrad EK80 file format