Echogram interpretation
The interpretation of echoes, represented by a progression of pings and samples, may not be easy. Transducer and electronic artifacts, can compete with signals from many types of biomass and the environment. The following images show examples of echogram interpretation:
Transducers
- Single beam echosounder
- Split beam echosounder
- Dual beam echosounder
- Multibeam sonar
- Imaging sonar
- Scanning sonar
Examples of phenomena
Vertical mount
| Acoustic beam deadzone - referenced | 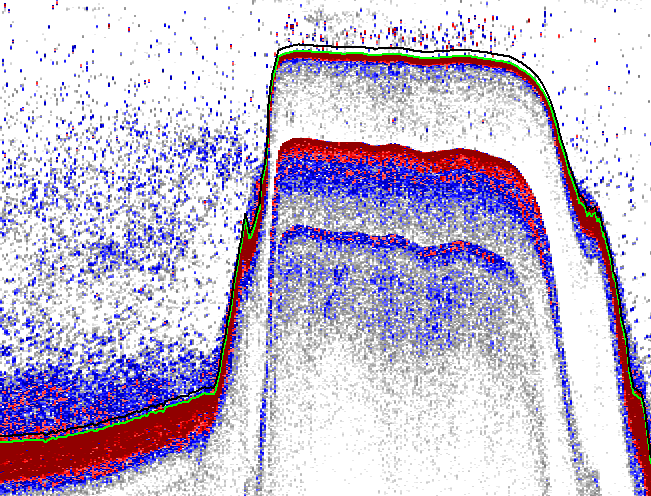 |
||
| Attenuated signal | 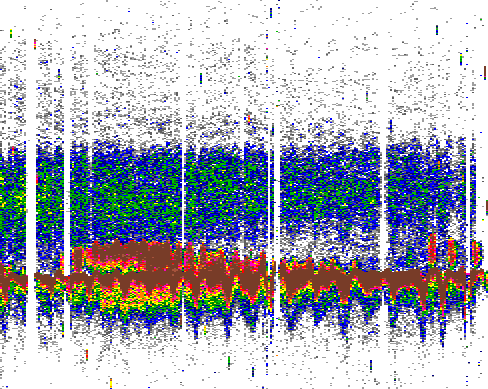 |
||
| Bubbles from sediment+ | 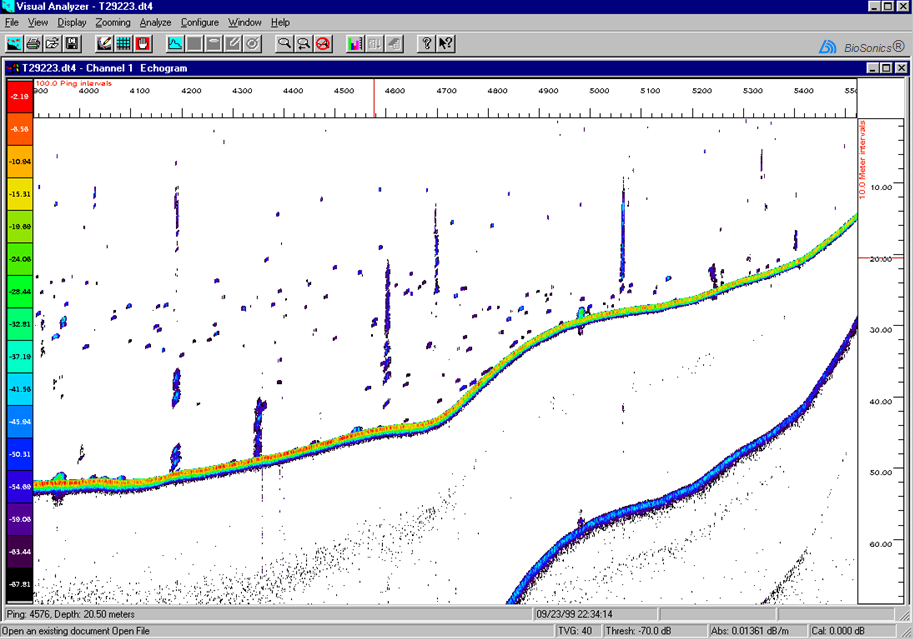 |
||
| False bottom | 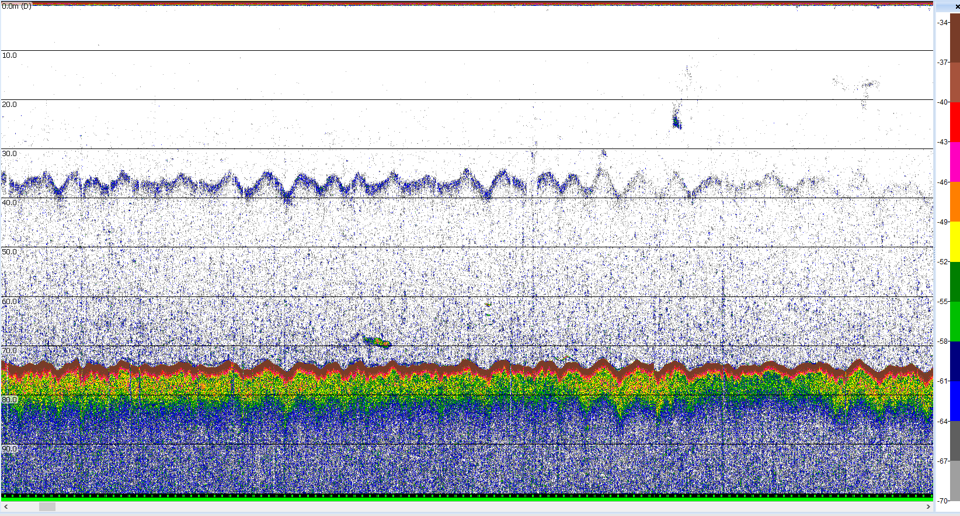 |
Intermittent noise |
False bottom, Renfree and Demer 2016 |
| Fish aggregations, 2nd and 3rd echoes | 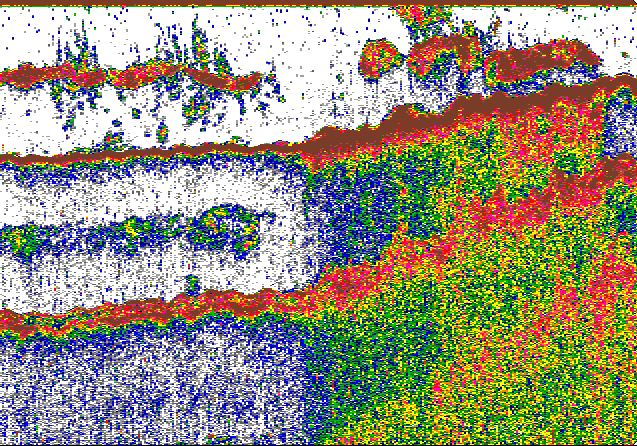 |
||
| Impulse noise | 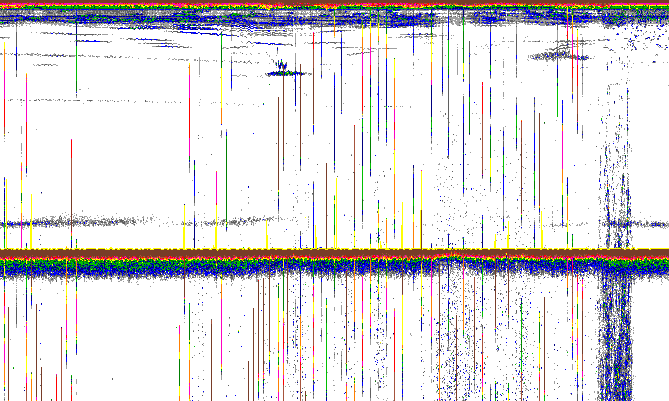 |
||
| Intensity steps+ | 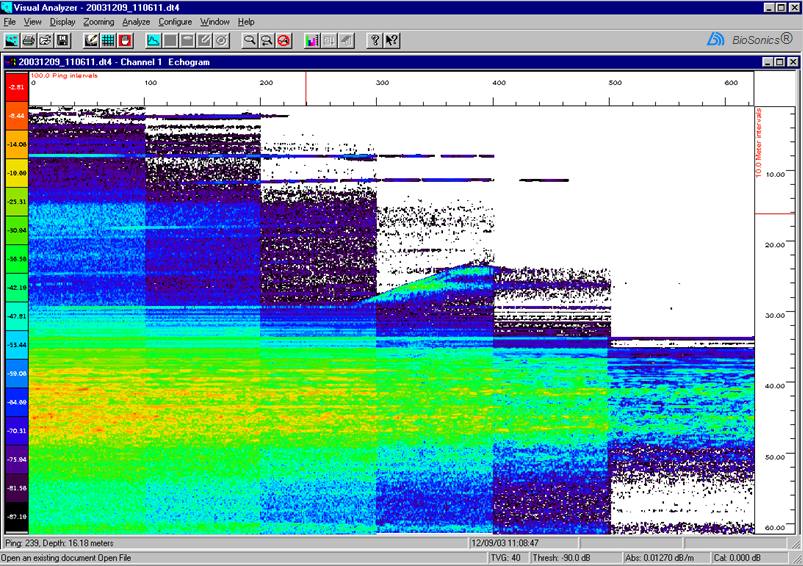 |
||
| Intermittent spike noise | 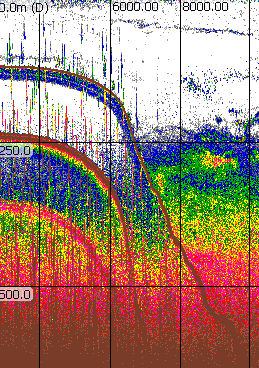 |
||
| System noise+ | 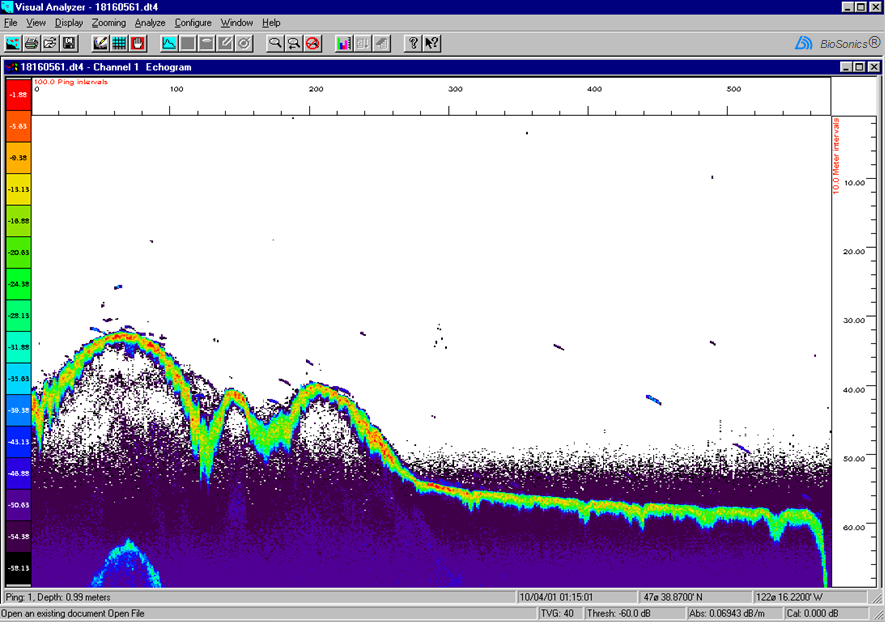 |
||
| System noise electrical | 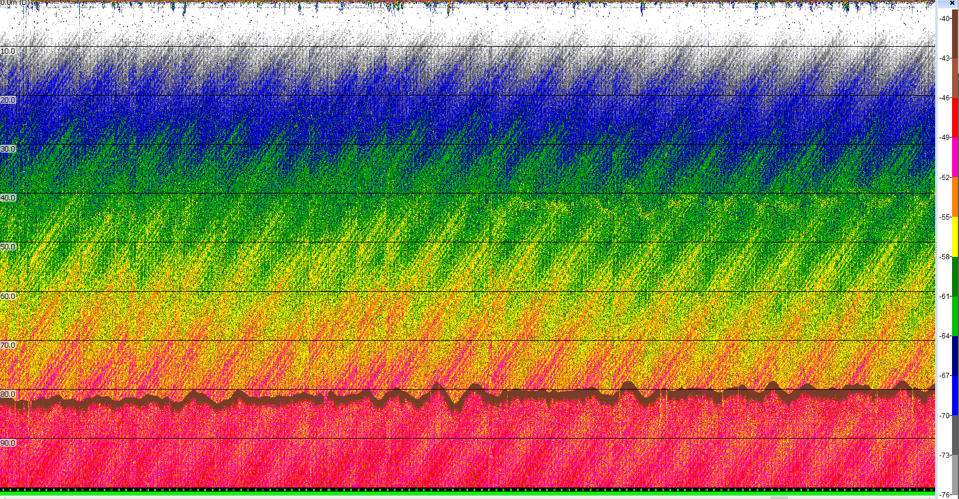 |
System noise electrical |
System noise possibly |
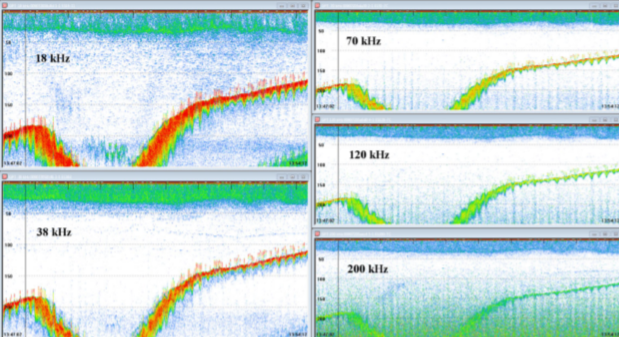
| Side lobe reflection from steep side of basin and tilted transducer mount+ | 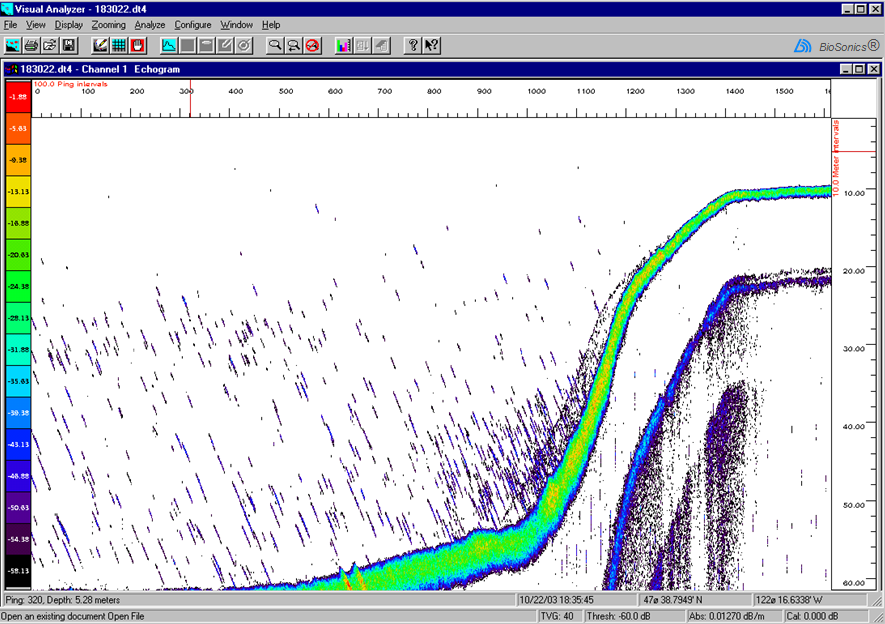 |
||
|
Signal from beam side lobes |
 |
||
| Standard sphere calibration | 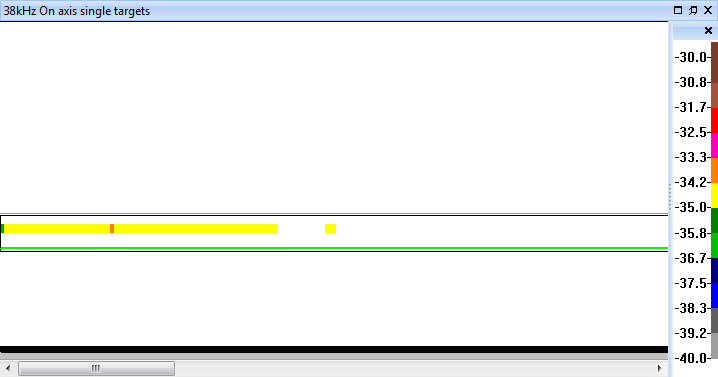 |
||
| Submerged vegetation - reservoir bottom | 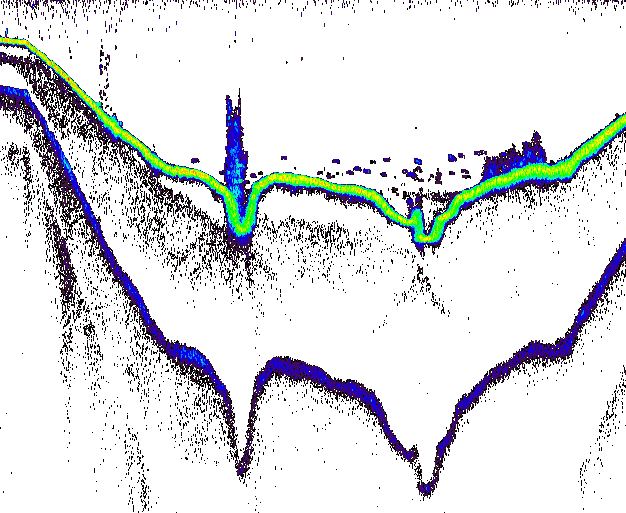 |
||
| Structure, targets heading in different directions+ | 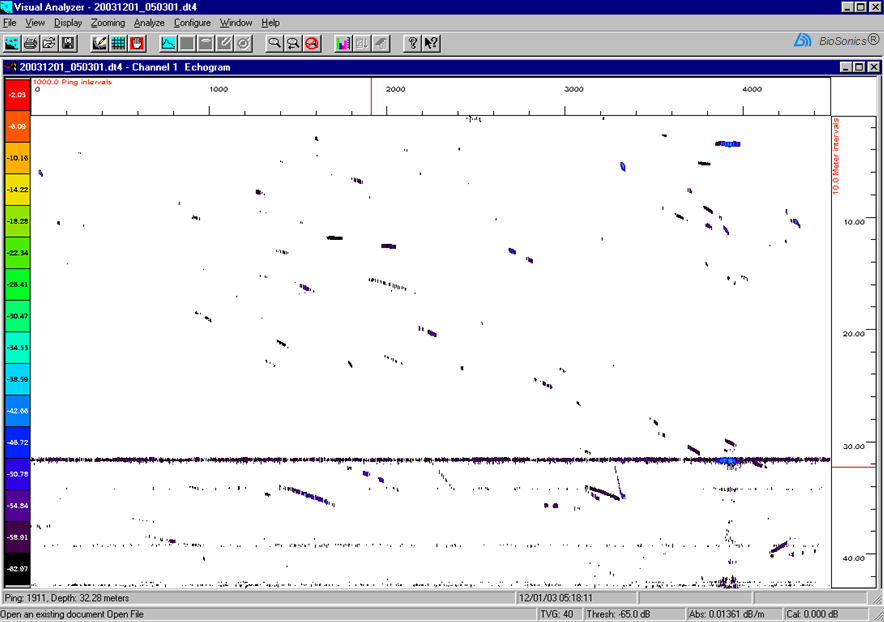 |
||
| Transducer ringing | 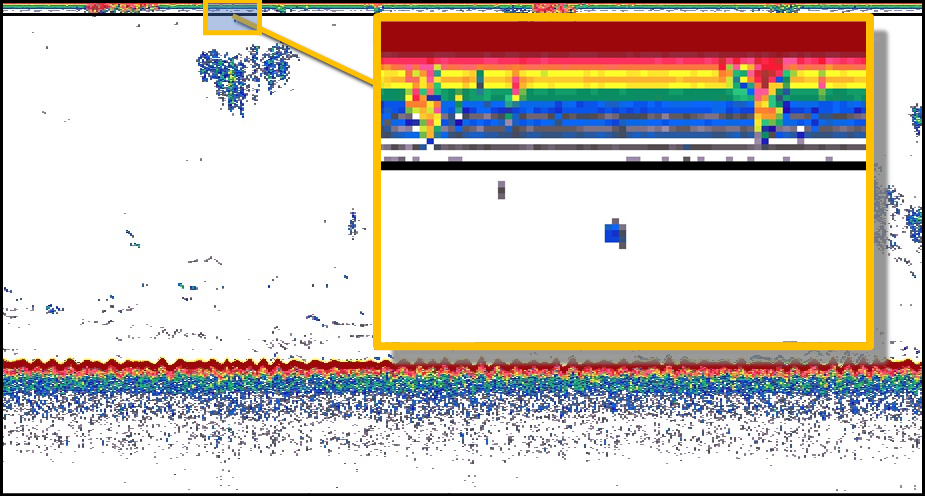 |
Not to be confused with the Near-field depth. | |
| Transducer tilted - diving fish+ | |||
|
Transient noise |
|||
| TVG-noise stripes | 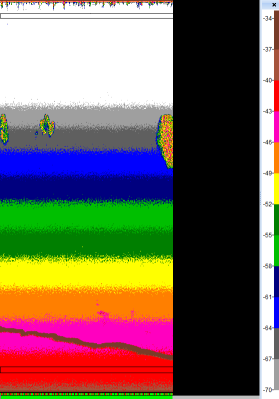 |
||
| Upward facing transducer | 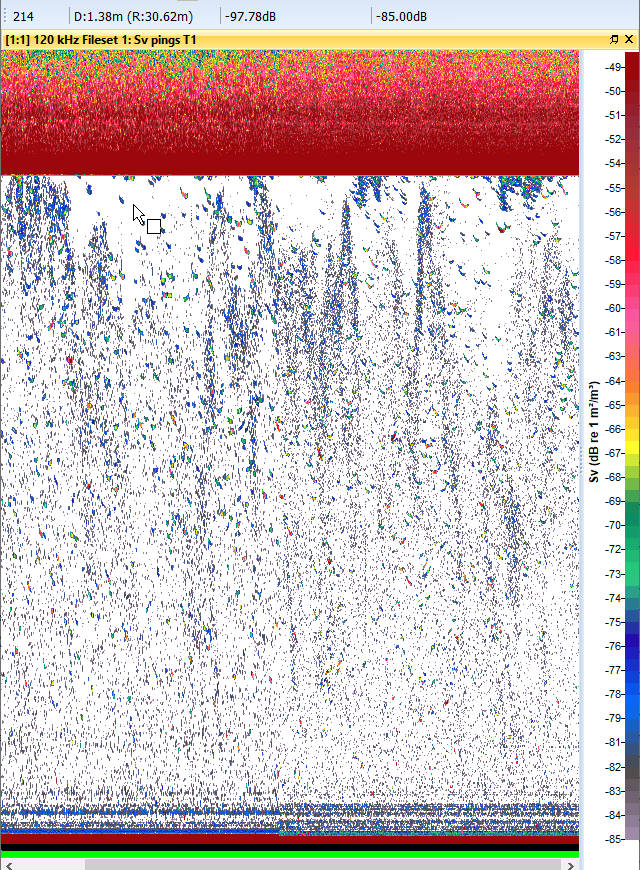 |
||
| Wideband ringing and side lobe return from a trawl body | 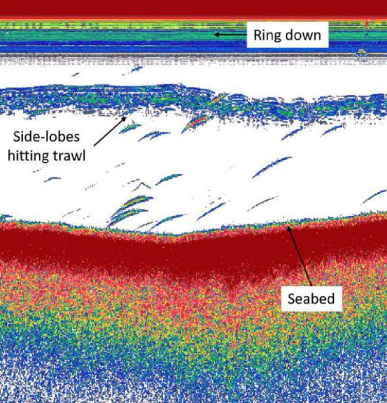 |
Horizontal mount
| Boat wake, fish and rock | 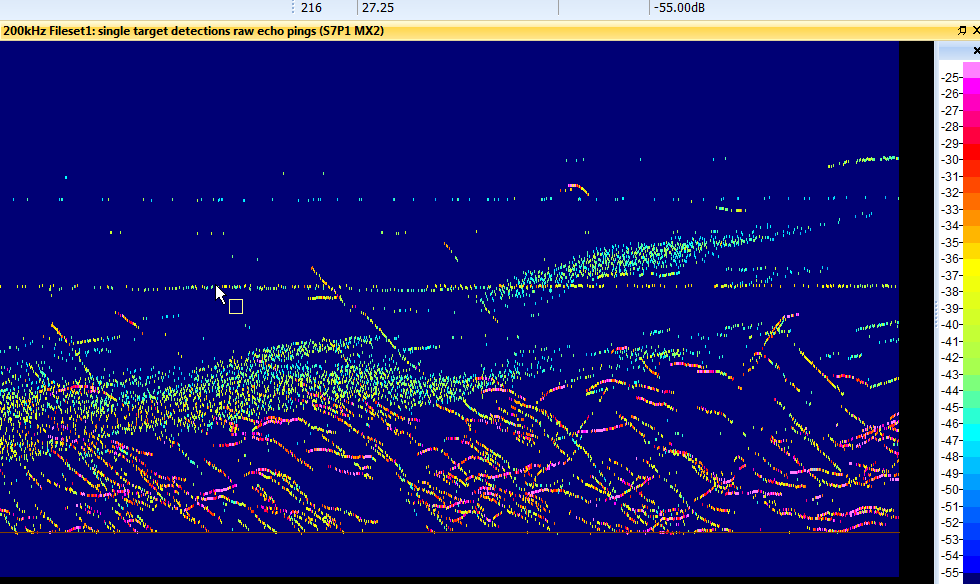 |
| Imaging sonar - fish "arcing" |  |
| Multi-path reflections from fish when the beam is grazing the boundaries+ | 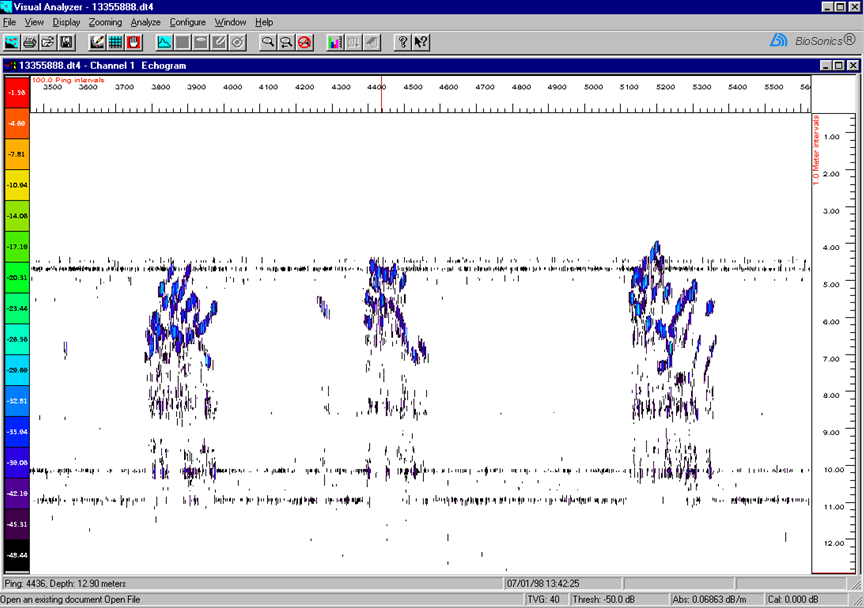 |
| Wallowing fish+ | 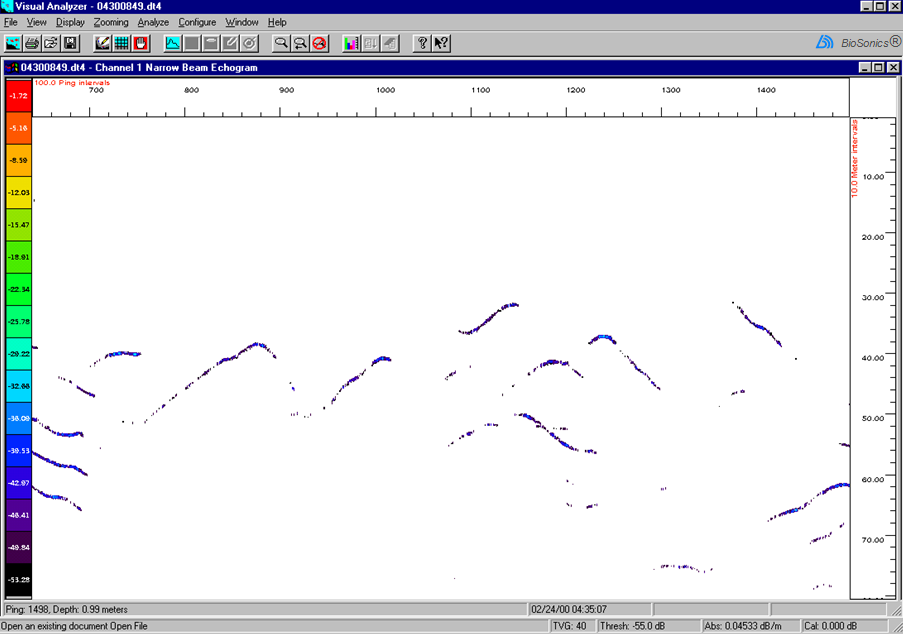 |
+Screen shots of echograms displayed in BioSonics Visual Analyzer and the interpretations are included with the kind permission of Mr. James Dawson and Mr. Robert McClure of BioSonics.
See also
About echograms
About multibeam echograms
Using Echoview: Key concepts
Data processing workflow