XxY Statistic
This operator applies an XxY statistic filter to the echogram.
You can define the statistic and the size of the convolution window on the XxY Statistic page of the Variable Properties dialog box.
Echoview accepts operands with the following data types:
- Boolean
- Color
- Linear
- Power dB
- Sv
- TS
- Unspecified dB
This flexible operator may be of use with edge detection, intermittent noise removal and other signal processing tasks.
Note: Under live viewing, the Live Export based on a convolution variable may be limited.
Settings
The XxY Statistic Variable Properties dialog box pages include (common) Variable Properties pages and these operator pages:
Operands page
XxY Statistic page
This page is used to specify the convolution filter statistic and the size of the convolution window.
|
Setting |
Description |
|
Statistic |
Select a convolution statistic to use. |
|
Percentile (%) |
Specifies the Nth Percentile (0 to 100%). |
|
Rows (samples) |
Specifies the number of rows (X) in the convolution window. The row value is restricted to an odd number, between 1 and 999, and spans sample space. |
|
Columns (pings) |
Specifies the number of columns (Y) in the convolution window. The column value is restricted to an odd number, between 1 and 999, and spans ping space. |
|
Input samples per calculation |
Displays the number of input samples for each calculation. This number is based on the specified Row and Column settings. Although you can set Row and Column to any odd number between 1 and 999, this operator's performance decreases as the product of these settings increases. A warning is displayed when the value for the Input samples per calculation is greater than 1000. |
Algorithm
Available XxY Statistic filter kernel algorithms.
|
Statistic |
Value |
|||||||||||||||||||||
|
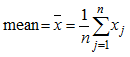
The mean of the values in the XxY window. The mean is calculated in the linear domain.
Where:
|
||||||||||||||||||||||
| The minimum of the values in the XxY window. | ||||||||||||||||||||||
| The maximum of the values in the XxY window. | ||||||||||||||||||||||
| The median of the values in the XxY window. The median is the sample value of the 50th percentile. | ||||||||||||||||||||||
| Percentile (%) | The Nth percentile score of the values in the XxY window. yI, J (window) = Wk + (Wk+1 - Wk) (k' - k)
|
|||||||||||||||||||||
|
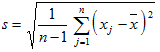
The standard deviation (s) of the sample values in the XxY window. Standard deviation is calculated in the linear domain. The (n-1) term is used when a subset is taken of a population. Here, the XY window is a subset of the echogram samples.
Where n, xj and |
||||||||||||||||||||||
The variance (s2) of the sample values in the XxY window. The variance is calculated in the linear domain. The (n-1) term is used when a subset is taken of a population. Here, the XxY window is a subset of the echogram samples. The variance is s2, where s is defined as above. |
||||||||||||||||||||||
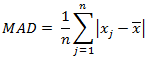
The mean absolute deviation (MAD) of the sample values in the XxY window. MAD is calculated in the linear domain.
Where n, xj and |
||||||||||||||||||||||
The coefficient of variation (cv) of the sample values in the XxY window. The coefficient of variation is calculated in the linear domain.
Where s and |
||||||||||||||||||||||
The kurtosis of the sample values in the XxY window. The kurtosis is calculated in the linear domain.
Where n, xj, s and |
Notes:
- For details on how convolutions are applied in Echoview see Convolution algorithms: Convolution filter operators.
- The convolution window shrinks as it approaches the edge of the data.
- Calculations for samples with dB values are carried out in the linear domain. Results that are unitless ratios are linear. Results that have units are generally converted back into the dB domain.
- Calculations for samples with boolean values assume False = 0 and True = 1. A non-zero result is interpreted as True. A zero result is interpreted as False.
- Calculations for samples with color values handle the Red, Green and Blue components as integers between 0 and 255. White is 255, 255, 255.