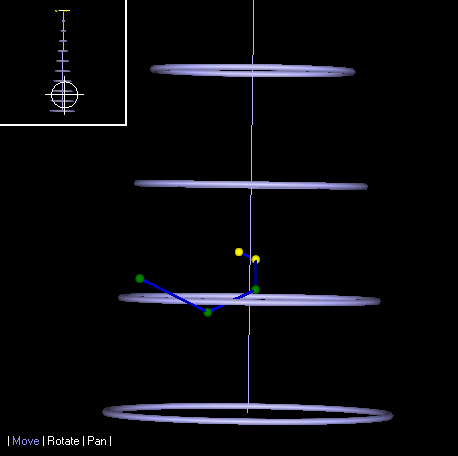
3D Single targets graph
The 3D single targets graph provides a 3D graph of single targets in a selection or region on a single target echogram. Previously detected fish tracks that are located in the region or selection are displayed as single targets joined by a series of arrows indicating the direction of movement. The graph can display a single 3D beam (as in the example below) or multiple 3D beams.
Rings on the graph represent the beam shape, there are 10 evenly spaced rings per graph. The diameter of the rings is calculated using the calibration settings from ping 0 of the data.
A transparent square represents the surface. Yellow balls represent the geographic position of each ping that occurs within the selection of pings that are included in the graph. They have no scale.

To view a 3D single targets graph for a selection:
-
Make a selection using one of the selection tools.
-
On the Shortcut menu (right-click), point to Graph Selection, then click 3D Single targets.
To view a 3D single targets graph for a region:
-
Select a region.
-
On the Shortcut menu (right-click), point to Graph Region, then click 3D Single targets.
Displaying a single beam or multiple beams
To switch between displaying a single 3D beam and multiple 3D beams:
-
Open the EV File Properties dialog box
-
Click the Fish Tracks tab
-
Select or clear the Show multiple 3D beams option
Note: 3D single targets graphs require a lot of memory and are currently limited to approximately fifty evenly spaced beams (including the first and last beams), when the Show multiple 3D beams option is selected.
To change the display size of single targets (and connecting arrows if displayed):
-
Press CTRL+T to increase display size
-
Press CTRL+Y to decrease display size
To change the display size of the rings representing a 3D beam:
-
Press SHIFT+CTRL+T to increase display size
-
Press SHIFT+CTRL+Y to decrease display size
Display legend
Each target is displayed as a sphere in the same color with which it is displayed on the single targets echogram. That is, the color conveys the target strength of the target according the selected color scheme.
Fish tracks are displayed by connecting single target spheres with a line of the same color as the region which defines the track on the underlying single targets echogram. These are randomly assigned. Each line has an arrow pointing in the direction of increasing time (from first to last target in the track). You may need to zoom in to see the direction of the arrow.
Trouble shooting
- For help on navigating around 3D single targets detection graphs, see:
- Dynamic 3D images are very demanding on a computer's memory and graphics card. If you are experiencing quality or performance problems, see 3D display problems.