Calculating range and depth from exported data
The data that are exported to underlying data export files and data value export files do not include the depth and range of each sample (data point). However you can calculate the depth and range of each sample using the following exported data that are exported for each ping:
|
Variable |
Description |
|
Depth_start |
The depth at the top of the first sample in the ping that falls within the analysis domain |
|
Depth_stop |
The depth at the bottom of the last sample in the ping that falls within the analysis domain |
|
Range_start |
The range at the top of the first sample in the ping that falls within the analysis domain |
|
Range_stop |
The range at the bottom of the last sample in the ping that falls within the analysis domain |
|
Sample_count |
The number of samples in the ping that fall within the analysis domain |
Notes:
-
See also About start and stop ranges.
-
Both excluded-samples and good samples from the analysis domain will be exported and included in the sample_count. A special export value is output for excluded-samples in data exports.
-
When exporting data values for a region, a value is exported for every sample within the bounding rectangle of the region. A special export value is output for samples that do not fall within the region.
Equation
The range of a sample can be calculated using the following equation:
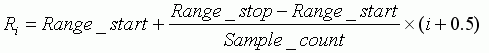
Where:
Ri = range of sample number i
i = sample number (where the first sample = 0 and the last sample number = sample_count -1)
You calculate the depth of a sample using the same equation except you use Depth_start and Depth_stop.
Using a spreadsheet to calculate sample depth or range
You can use a spreadsheet (or other) program to calculate the range and depth of all samples in an export file, however, depending on which spreadsheet application/version you are using, it may be necessary to transpose the export file (so data values run down rather than across the page) before you do so. Echoview support can, on request, provide a program you can use to transpose your export files.
Excel formula for calculating range and depth for Sv, TS, dB, linear, Boolean and color value samples
If you are using Microsoft Excel to calculate sample depth and range, you can use the following formula to calculate the depth and range for each sample:
= Range_Start + (Range_Stop - Range_Start) / Sample_count * (ROW()-ROW(Row_first) + 0.5)
Note: You will need to rename the relevant cells as above or change the formula so it refers to cells by their grid reference, e.g. A1, A2. Row_first is a cell in the first row of samples.
Excel formula for calculating range and depth for angular position samples
If you are using Microsoft Excel to calculate sample depth and range, you can use the following formula to calculate the depth and range for each sample:
= Range_Start + (Range_Stop - Range_Start) / Sample_count * (TRUNC((ROW()-ROW(Row_first))/2) + 0.5)
Notes:
-
The TRUNC function in this formula are required because two rows are present for each sample, i.e. the minor and major axis angles respectively.
-
You will need to rename the relevant cells using the names above or change the formula so it refers to cells by there grid reference, e.g. A1, A2. Row_first is a cell in the first row of samples.