About analysis domains
- Analysis domains in Echoview
- What is included in an analysis domain?
- Analysis based on regions and samples
- Settings affecting analyses
- Excluded data points
- See also
Analysis domains in Echoview
Analysis domains are a group of features in Echoview that allow you to demarcate or isolate sections of your data to perform on screen or export analyses on.
Refer to the links under the corresponding sections for further information on the analysis domains.
The content on the rest of this page informs you of the general behavior of analysis domains.
These analysis domains features are currently available to single beam data. For information on multibeam analyses, refer to multibeam echograms or scenes (for multibeam data).
Cells
Cells are formed from the interval (time or distance) and depth (depth, range or line-referenced) line intersections on an echogram that you set up on the Grid page of the Variable Properties dialog box.
Use cells to divide your echogram into regularly spaced sections for your analyses.
You can also create an analysis domain that combines regions and cells (analyses by regions by cells).
Echograms
If your sample comprises the whole echogram, you can treat the entire echogram as an analysis domain.
Fish track regions
Use an operator to automatically identify the single targets from your TS echograms. Next either detect the fish track regions or manually connect individual single targets to form fish tracks regions, then use these regions for your analyses.
Regions
Use one of the selection tools to create regions that encompass sections of your data for your analysis.
You can also create an analysis domain that combines regions and cells (analyses by regions by cells).
Transects
Demarcate start and stop time ranges to filter the underlying data with a transect. All other analysis domains are constrained to where they overlap with transects.
What is included in an analysis domain?
Single beam and single target echograms
Echoview includes data points (e.g., the ping) with time/distance or depth coordinates inside the boundary of the analysis domain, in the analysis.
Note that the time or distance value corresponds to the center of the data point.
The following table summarizes how Echoview treats data points with time/distance or depth coordinates on a boundary of the analysis domain.
|
If the data point is on the... |
Then... |
|
Upper boundary |
it is included in the analysis domain |
|
Lower boundary |
it is not included in the analysis domain |
|
Left boundary |
it is included in the analysis domain |
|
Right boundary |
it is not included in the analysis domain |
Notes:
- In echograms, the range of the sample represents the sample data point. For more information refer to About stop and start ranges.
- In single target echograms, the range of the single target (the top of the rectangle) represents the single target data point. From more information refer to About single targets: Single target display.
- Selections, 2D regions and cells are all defined in time/depth coordinates.
- Lines in Echoview have a higher precision than Sv sample ranges. As a result the (line) boundaries of an analysis domain may not lie on sample boundaries or may bisect samples. Similarly, the (line) boundaries of an analysis domain may not lie on single target boundaries.
- Heave compensation can change the start depth of a ping, and may affect the membership of pings in an analysis domain and hence affect analysis variable calculations.
- The boundary rules apply to cells in the Cell statistic operators.
Multibeam echograms
Created, detected or virtual surfaces may be used as boundaries to include data points for detections and analysis. Data points inside the boundary are included. Data points outside and on the boundary are excluded.
Scenes (for multibeam data)
Analysis domains on scenes take the form of 3D regions.
Data points are included in an analysis domain if:
-
- the latitude, longitude and depth coordinates of the data point are inside the boundary of the analysis domain, and
- the time of the ping on which the data point is, lies within the valid time of the analysis domain
Data points with latitude, longitude and depth coordinates that place them on the boundaries of the analysis domain are highly unlikely to occur and inclusion is undefined in this circumstance.
Data points can be excluded from analysis domains on scenes with the usage of Exclude above and Exclude below surfaces.
Analysis based on regions and samples
Data points (samples or single targets) are treated as no data if they are:
- Within a Bad data (no data) region and Apply bad data regions is applied.
- Samples with a value of no-data or within a range interval for no-data (on single target echograms)
- Within a ping where the Exclude below line (if one is defined) has a status of “bad” and Set pings with bad line status on the exclude below line to no-data is applied
These samples are assigned a value of no data and they have no sample thickness. In effect, such samples are not counted in the calculations of Thickness_mean and Height_mean. See also the special case below.
Selecting Apply bad data regions also affects:
- Samples within a Bad data (empty water) region. These samples are assigned a value of -999 dB (effectively zero backscatter) and are counted in all calculations.
- Single targets within a Bad data (empty water) region. These single targets are excluded from further analysis.
Special case
Samples within a Bad data (no data) region or with a value of no data in concert with the selection of the Analysis page settings Apply bad data regions and Include the volume of no-data samples.
These samples are assigned a value of no data and have a sample thickness. The sample thickness is included in calculations of the Thickness_mean and Height_mean. The settings can affect both entire pings and parts of pings. The key intent of this special case is the robust assumption (in the absence of any further information) about samples in Bad data (no data) regions. You are assuming, in effect, that these samples have a backscatter value equal to the mean of the good samples in the domain.
Prior to Echoview 5.4 it has always been possible to make this (commonly-desired) assumption by scaling the reported Thickness_mean of the domain (and hence the NASC) using the various analysis domain analysis variables (no_data_samples etc.).
Integration cues and outcomes - examples
|
Use Apply bad data regions |
Use Apply bad data regions Use Include volume of no data samples |
|
|
Hatching cue, Outcomes, Assumptions |
Hatching cue, Outcomes, Assumptions |
|
|
|
Purple border, grey hatch. |
Purple border, grey hatch. This data effectively is converted to the mean of the analysis domain. This gives you greater flexibility in calculating your NASC based results. |
|---|---|---|
|
|
Green hatch. This data is deemed to have no acoustic return. |
Green hatch. This data is deemed to have no acoustic return. |
|
|
Red hatch. Good samples used in analysis calculations. |
Red hatch. Good samples used in analysis calculations. |
Intersections
Data points in intersections of regions or other designated areas may change in nature, for calculation purposes, according to an order of precedence:
- Good
- Bad data (empty water)
- Bad data (no data)
- Above Exclude above line
- Below Exclude below line
With the Good category being dominated by any of the following categories, and the Below Exclude below line category dominating any of the preceding categories.
The Processed data operator can often make clear how samples are affected by Analysis page settings.
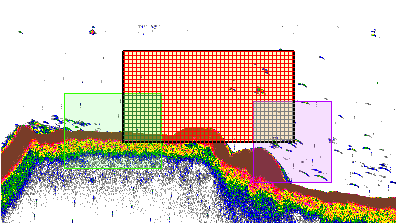
|
The screenshot to the right shows region types, integration cues and intersections. Regions include:
|
 |
Settings affecting analyses
Data points (samples or single targets) that are included in an analysis domain are then retained or discarded for further analysis based on the settings defined on the Analysis page. The content of this section may benefit from the topics and background covered by About samples and echo integration.
Exclusions based on lines
Data points are excluded from further analysis if they are:
- Above the Exclude above line (if one is defined)
- Below the Exclude below line (if one is defined)
Exclusions based on surfaces
Data points that are included in an analysis domain are then retained or discarded for further analysis based on the settings defined on the Analysis page.
Data points are excluded from further analysis if they are:
- Above the Exclude above surface (if one is defined)
- Below the Exclude below surface (if one is defined)
Note: Surface exclusion settings may affect specified Exclude above and Exclude below surfaces.
Transects and analysis domains
An assigned transect group affects analysis domains. Refer to transects and analyses.
Excluded data points
Excluded data points are ignored for these primary calculations:
- Thickness_mean and Height_mean
- Sv_mean
- Beam_volume_sum
- Wedge_volume_sampled
- TS mean, TS minimum, TS maximum and TS standard deviation
- Target depth mean
- Target length mean
- Number of single targets
- 2D School Detection module analysis variables - Uncorrected_area and 3D_school_volume
In turn, these quantities variously affect the calculation of:
- Area_backscatter_strength
- ABC
- NASC
- Density_number
- Density_weight
- 2D School Detection module analysis variables - Corrected_area and Image_compactness
Notes:
- Thickness_mean, Sv_mean, ABC and NASC are key quantities in echo integration. Excluded samples do not contribute to these quantities. If you have bad data, we recommend that you fully understand the implications of any quantities you assign to a given volume of water, such as the fish density in a given alongtrack interval. See About samples and echo integration for further discussion, or contact support@echoview.com.
- Excluded samples do not alter the definition of the analysis domain itself. The analysis domain's boundaries remain unchanged. These exclusions apply to the analysis of samples within the analysis domain.
- Echoview 5.4 introduced general analysis variables Bad_data_no_data_samples and Bad_data_empty_water_samples to represent samples in the region types Bad data (no data) and Bad data (empty water). In Echoview 5.2 samples within bad data regions with a value of no data are labeled as bad_data_samples. In versions 5.1 and older, these samples are labeled as no_data_samples.
Good data points
The data points that are included in an analysis domain and not subsequently excluded are known as good data points.
When you perform an on-screen integration or an on-screen analysis of an analysis domain, all good data points will be overlaied with analysis-hatching (providing that the Show Analysis option on the Echogram page of the EV File Properties dialog is selected).
Tip
You can view the good data points for an entire echogram using the Processed Data operator. This operator assigns a value of no data to excluded data points.
You can view information about a data point as follows:
-
To view time information about a data point, move the mouse point over the data point and check the status bar.
-
To view depth and range information about a data point display the Details dialog box (F9).
See also
About analysis
About analysis variables
Samples
About integration
About samples and integration
About no data
Thickness mean and Height mean
ABC and NASC
About biomass estimation
About single targets
About no data
Sv_mean
Analysis page
Bad data regions
Special data values