How to determine logged draft
The SimradDraftLogging calibration setting is only applicable for Simrad Sv and TS variables based on Q telegrams and single target variables based on E telegrams and only when these variables include a logged draft. That is, when a transducer depth was configured in the echosounder at the time of logging. If the data in the variable does not include a logged draft, the SimradDraftLoggingsetting can be ignored. See Logged draft warning for a more detailed description.
Prior to Echoview 5, the SimradDraftLogging value (previously known as the Logged Draft) was subtracted from echogram display limits. This changed the layers of the echogram and as a result affected exported analyses, particularly single target and fish track analyses. With Echoview 5, the SimradDraftLogging value is not subtracted from echogram display limits. There may be slight differences in the single target or fish track exported analyses when comparing the analyses pre and post Echoview 5.
Note: We strongly recommend logging data with transducer depth set to 0 and using Echoview's transducer geometry to model the draft.
Logged draft for single target variables
The correct value to enter for SimradDraftLogging for single target variables (E telegram data) may be assumed to be the transducer depth entered in the echosounder at the time of logging.
Logged draft for Sv and TS variables
Determining the SimradDraftLogging for Q telegram data is not straightforward. The value that should be entered may not be identical to the 'Transducer depth' that you configured in your echosounder. This is due to rounding in the echosounder. The correct value may also be different for different variables, even though the echosounder only has one transducer depth setting. This is due to different data resolutions.
Variables derived from Q telegram data will include a number of below threshold values between the echogram start range and the transducer depth. These are displayed in Echoview with the below threshold value of -999.0 dB.
The easiest way to determine logged draft for these variables is to determine it visually from the echogram. By placing the cursor over samples, you can observe the value of the sample in the third data panel on the toolbar. Start at the top of the echogram and scan down the sample values to find the first sample which has a value other than -999.0 dB. The range (displayed in the second data panel) for this sample is the SimradDraftLogging value that should be entered for the variable being viewed. You may need to zoom in closely to get an accurate value.
The alternative way to determine logged draft for Q telegram variables is to first calculate the sample thickness (or data resolution) and then count the number of below threshold (-999.0dB) values there are at the top of the echogram. Therefore, logged draft can be calculated as follows:
Logged draft = Sample Thickness × Number of below threshold values at the top of the echogram
Where:
Sample Thickness = Data Range / Number of data points
Where: Data range and Number of data points are the values displayed under Ping (from file) on the Details dialog box (F9).
Example
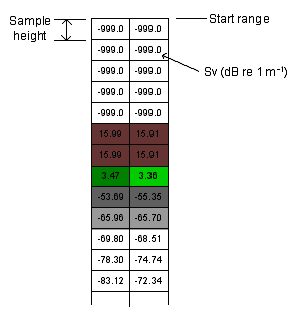
Illustrated below is an extract from two pings of an Sv echogram, with the samples clearly marked and the Sv value for each sample shown:

In this instance the logged draft is five samples in size. The following was read from Ping (from file) on the Details dialog box (F9).
Start range = 0 m
Stop range = 250 m
Data range = 250 m
Number of data points = 250
So the sample thickness is 1 m and the Logged draft 5 m.
The data were collected with a transducer depth of 5.6 m.
Different variables from the same transducer may have different logged drafts
The logged draft is a function of the start range, stop range and number of data points, which can vary from one variable to the next - in particular if different frequencies are in use.
For example, if 250 data points are sampled over 500 m at 38 kHz data and over 250 m at 120 kHz, the sample thicknesses will be 2 m and 1 m respectively, and the logged draft may subsequently be different between the 38 kHz echogram and the 120 kHz echogram.
“Less than” not “less than or equal to”
Testing with BI500 data from an EK60 echosounder we have observed the following:
Configured with:
Start range = 0 m
Stop range = 100 m
Data range = 100 m
Number of data points = 10
Sample thickness = 10 m
Varying the configured transducer depth produced the following Logged drafts:
|
Transducer depth |
Logged draft |
|
9.99m |
0m |
|
10.00m |
0m |
|
10.01m |
10m |
From which we conclude that Simrad employs a “less than” test, not “less than or equal to” in generating embedded draft data.
We recommend determining the log draft empirically from your data rather than relying on calculations, as we have not been provided with a formula by Simrad for calculating the Logged draft.
See also
Logged draft warning
About transducer geometry
About beam geometry
About draft