About the Cell statistic operator
The Cell statistic and the Cell statistic [Single targets] operators accept Sv data or single target data and output cell samples that are set to a selected cell statistic. The grid for the cell is specified under the Grid page of the operator. The available Cell statistics are: Mean, Minimum, Maximum, Median, Percentile and Number of samples/targets. Cell statistics can be used to mask original data. This combination of processes can offer information-rich visualizations, based on qualitative calculations, and enable innovative analysis insights into your data. The Cell statistic operator is licensed with the Advanced Operators module.
Note: Samples that are excluded or thresholded affect the calculation of cell statistics.
- Cell statistic settings
- Cell statistic algorithms
- Examples of use
- Future enhancements
Proxy for fish density
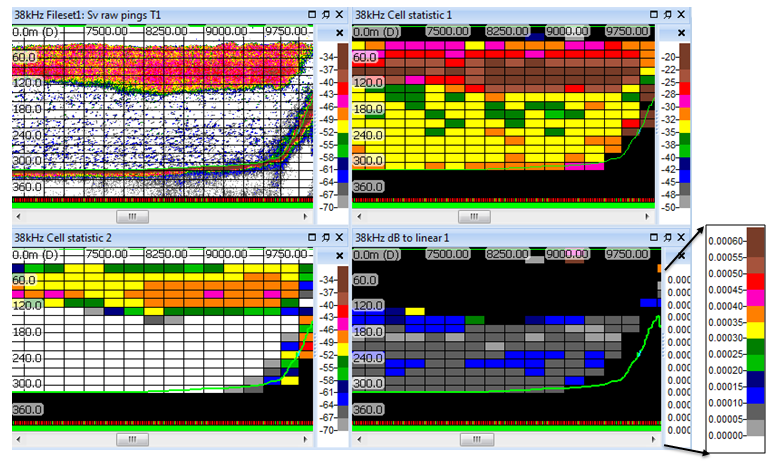 |
Top left: Raw Sv data. Bottom left: Cell statistic (Mean Sv) on raw Sv data. Top right: Cell statistic (Mean TS) on single target data. Bottom right: Fish per cubic meter, restricted to the cells where the mean Sv is <-64dB. |
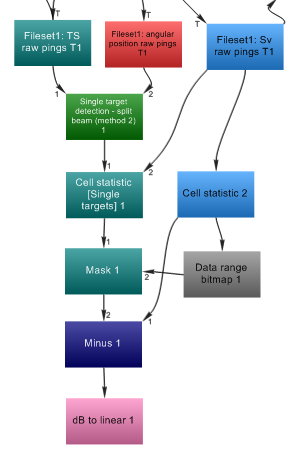
Dataflow for a Proxy for fish density (Sv - TS = 10 log ρ)
 |
|
TS calibration with a Calibration sphere
 |
The Cell Statistic operator can provide visual guidance whilst calculating TS calibration with a calibration sphere and tuning the single target detection of the sphere. See also: Calibration Assistant dialog box
|
Calculating the number of fish per acoustic sampling volume
When calculating biomass it is important to evaluate the density of organisms in the water column: if the density is too high it is not possible to obtain reliable in situ TS values. The calculation of the number of fish per acoustic sampling volume (Nv), sometimes known as the Sawada index, and the ratio for multiple echoes (M) give you a confidence limit for TS estimation.
It is generally accepted that if a sampling volume has Nv < 0.1, then the hydroacoustic data can be included in in situ calculations (see Parker-Stetter et al. 2009). Sawada et al 1993, in their small study of Walleye Pollock, report that estimated TS was accurate when M is less that 70% and Nv is less than 0.04.
M, Nv
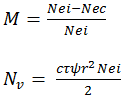
Where:
M is the ratio of multiple echoes when measuring a single target. Nei is the fish density output by the echo integrator.
This can be expressed as Sv_mean - TS_mean. See Proxy for fish density.
Nei is also know the quantity n as used by Sawada et al.
Note: Sawada (1993) uses a TS-fish length relationship from trawl data to estimate TS_mean. This may not be suitable in the case where you have no trawl data or the case where there is more than one species present. It is possible to use an iterative approach by calculating the TS_mean of cells. The iterative approach can be seen as circular, given that the calculated TS_mean is used to calculate an index for the appropriateness of the TS estimate.
Nec is the fish density from single target detection.
This can be expressed as Echo density = Number of single targets/Beam_volume_sum of single targets.
Echo density is output by the Cell statistic (single targets) operator.
Nec is also known as the quantity ns as used by Sawada et al.
Nv is the fish number in the reverberation volume where TS is estimated.
c is the speed of sound in water (m/s). τ is the effective pulse width (seconds). Ψ is the equivalent beam angle. The linear form is used in the equation for Nv.
Note: Ψ dB re 1 steradian = 10log(ψ)
r is range in meters (of the reverberation volume).
An example of the use of the density indices
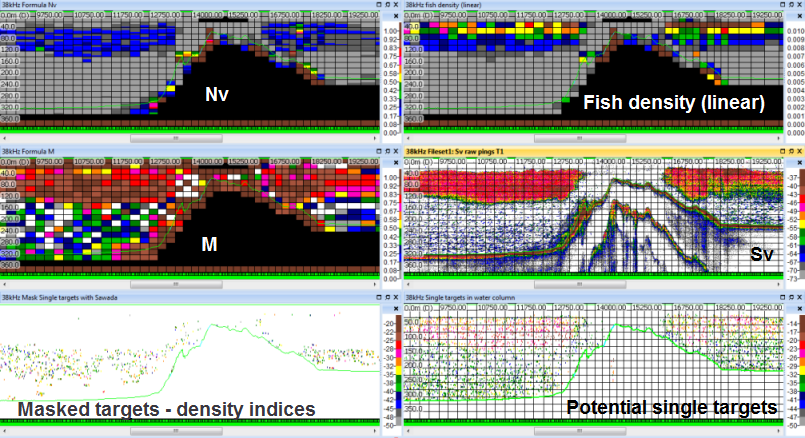 |
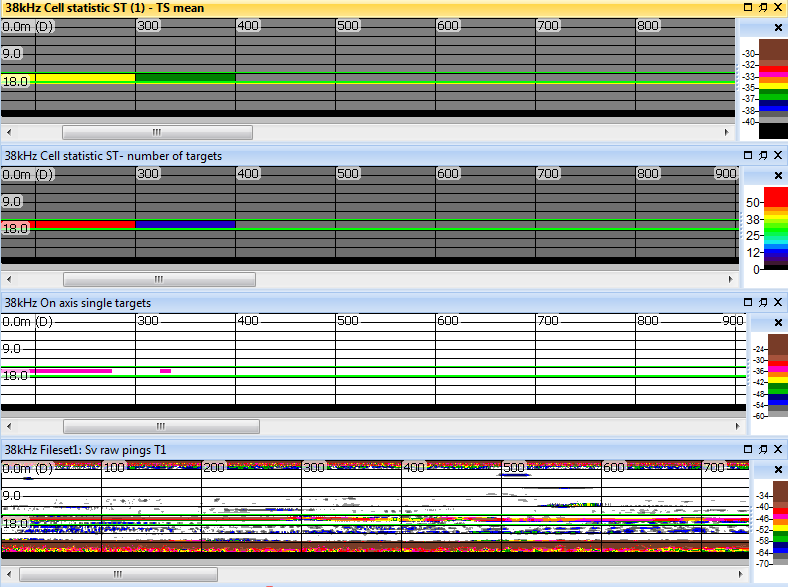
SvRaw variables for Sv, TS and angular position. Large schools of fish, single fish. Potential single targets in the water columnSingle target split beam detection (method 2) using TS and angular position. Fish density (linear)Sv(mean) dB - TS(mean) dB = 10 log ρ NvFormula operator output for the Nv equation. MFormula operator output for the M equation. M may be evaluated using other operators. Masked targets with density index criteriaDensity criteria M < 0.70 And Nv < 0.04 mask the single targets outside schools variable. The density index criteria may be evaluated using the Formula operator or with other operators such as Data range bitmap and AND.
|
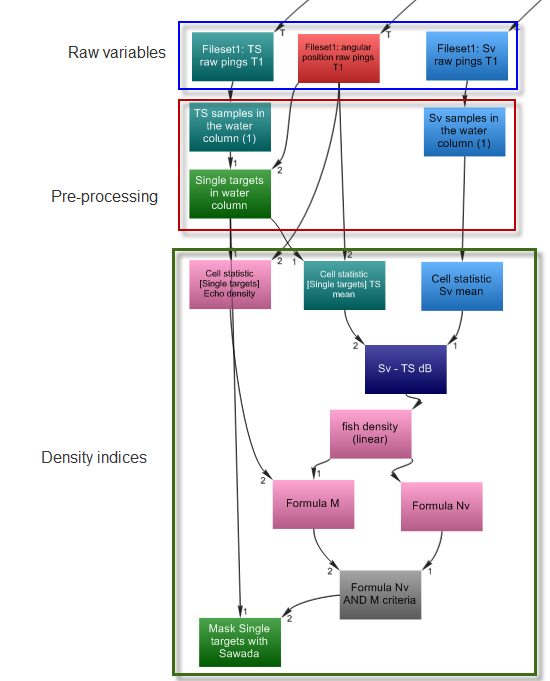
Example dataflow
|
This example uses an the TS_mean of a cell to evaluate density indices.
|
Note: Echoview's suite of operators can offer a number of ways to achieve a desired result. Pre-processing steps and later processing steps are shaped by the nature of the data and your analysis intentions. Generally, a greater the number of operators in a virtual chain means a greater calculation time. |
Density criteria
| Dataflow object name | Operator | Description |
Density criteria |
Cell statistic |
Sv samples outside schools, Statistic = Mean. Set fill empty cells with mean of surrounding cells. ResultCells with samples set to Sv mean of input operand cells. |
| Cell statistic [Single targets] TS mean | Cell statistic [Single targets] |
TS samples outside schools, geometry provided by angular position variable. Statistic = Mean. Set fill empty cells with mean of surrounding cells. ResultCells with samples set to TS mean of input operand cells. |
| Cell statistic [Single targets] Echo density | Cell statistic [Single targets] |
TS samples outside schools, geometry provided by angular position variable. Statistic = Echo density. Set fill empty cells with mean of surrounding cells. ResultCells with samples set to Echo density of input operand cells. |
| Sv(mean) - TS(mean) dB | Minus |
Cell statistic Sv mean. Cell statistic [Single targets] TS mean. ResultSv(mean) dB - TS(mean) dB = 10 log ρ, where ρ is fish density. |
| fish density (linear) | dB to linear |
Sv(mean) - TS(mean) dB. ResultCells that display Fish density in fish per cubic meter, for samples in the water column but outside of schools. |
| Formula M | Formula |
Fish density (linear), Cell statistic [Single targets] Echo density. ResultCells that display values for M. |
| Formula Nv | Formula |
c, τ, Ψ from Calibration page of Variable Properties dialog box. The linear form of equivalent beam angle is used. Nei is represented by V1 which is set to the fish density (linear) variable and r comes from V1. ResultCells that display values for Nv. |
| Formula Nv < 0.04 and M < 0.70 criteria | Formula |
V1 represents Formula Nv. V2 represents Formula M. Criteria from Sawada et al. f(p,s) = (V1<0.04) and (V2<0.7) ResultBoolean result that satisfies f(p,s). |
| Mask Single targets outside schools | Mask |
Single targets outside school masked with Formula Nv < 0.04 and M < 0.70 criteria. ResultDetected single targets that satisfy the density criteria Nv < 0.04 and M < 0.70. |
Future enhancements
Other cell statistics could facilitate other types of analysis. Please contact support@echoview.com if you'd like to work with new statistics in this area.
See also
About virtual variables
Operators: Cell statistic
Operators: Match geometry
Cell statistic settings
Cell statistic algorithms