About color schemes
This page covers:
Overview of color schemes
Echoview offers a choice of color schemes for displaying echograms and alongtrack displays. The color scheme you choose determines:
- data point colors (the colors that are used to represent data points that fall within a specific range of values),
- background colors,
- text colors,
- line colors,
- grid colors, and
- region colors.
Echoview provides a number of pre-defined color schemes (see below) and also provides the Echocolor utility program so you can create color schemes and change pre-defined color schemes. Each color scheme file is made up of two color schemes - a primary scheme and an alternate scheme - which you can toggle between by pressing the Y key.
You select the color scheme that is applied to a variable on the Echogram Display page of the Variable Properties dialog box. You select the color scheme that is applied to a scene on the General page of the Scene Properties dialog box.
You can specify a file location for custom color schemes on the File locations page of the Echoview Configuration dialog box. Echoview will search for color schemes at the default location and the user specified location.
Notes:
- Raw variables are automatically displayed with the color scheme corresponding to the type of data being displayed, e.g., Sv variables from a BioSonics data file will be displayed with the DT4 color scheme.
- Angular position variables are displayed with two predefined color schemes. See angular positions color legend.
- For echograms of "color" and "multibeam color" virtual variables (see data types) the selected color scheme is not used for coloring data points. Instead, the color scheme selected for the operand variable is applied to the resulting virtual variable. The selected color scheme for "color" and "multibeam color" variables is used for other elements of the echogram (e.g., lines and regions).
- Alternate color schemes are not currently available for echogram curtains.
- See also EV file-wide region type color settings and region class color setttings.
- Colormap color schemes are based on new matplotlib colormaps by Nathaniel J. Smith, Stefan van der Walt and (in the case of Viridis) Eric Firing. Useful reading on which color maps are better suited to visualizing continuous scalar data can be found in this article: Blackwell R. E., Harvey R., Queste B. Y., Fielding S. (2019). Colour maps for fisheries acoustic echograms. ICES Journal of Marine Science, fsz242, https://academic.oup.com/icesjms/article/77/2/826/5684813
The Chevreul Illusion
When viewing some echograms, you may observe an apparent gradient of brightness within areas of one color. For example, in figure 1 below there are in fact only three shades of green present, that is, three areas and in each area the color is uniform with no variation whatsoever. A gradient of brightness is clearly visible in the middle area however. In Figure 2, only the top and bottom areas have changed in color, the central area is unchanged. However no gradient is visible.
 |
 |
|
| Figure 1: The Chevreul illusion | Figure 2: No Chevreul illusion |
This is known as the Chevreul illusion and is a consequence of the way in which the retinal ganglion cells in the human eye react to light. If you cover the top and bottom areas of figure 1 with a piece of paper on the screen, you will see the illusion disappear in figure 1 as well. It is not a feature of the screen color, but a feature of the human eye.
Under most circumstances this illusion will be nothing more than a curious phenomenon. You will see it in some of the color schemes below for example. It is however possible to avoid it completely or in part by:
- using high contrast neighboring colors in the color scheme (many echosounder manufacturers use this kind of color scheme), or
- increasing the number of color steps in the color scheme (in Echocolor you can specify up to 1024 color steps).
Predefined color schemes
Pre-defined color schemes available in Echoview are:
- Angular positions colors
- ASL Environmental Sciences AZFP
- BlueView
- Boolean
- Default
- Depth
- DIDSON
- DT4
- Echoview 1.xx
- EK500
- EK80
- EM series
- EM series V2
- Furuno FQ80
- HTI
- Inferno
- Kaijo
- Kongsberg Mesotech M3
- Landscape
- Magma
- Monochrome (Gray, Gray reversed, Red, Green and Blue) color schemes
- Multibeam phase color scheme
- NASC and ABC
- Plasma
- RESON Snapshot
- Seascape
- Simrad scanning
- SM2000
- SM20
- Sonic
- Speed
- Velocity
- Viridis
- WASSP NWSF
Angular position color legend
|
|
Variables of angular position data type use two contrasting color schemes: minor-axis angle and major-axis angle. The resulting combination of the two colors (corresponding to two angles) is displayed. The display color (as seen in the color legend above) indicates the position within the incident beam for that sample. Echoview Software recommends using these color schemes for displaying angular position data.
It is possible to select the color schemes for the minor and major axes independently on the Echogram Display page of the Variable Properties dialog box. By setting one or the other to "none", the resultant echogram will encode only the position along one axis in color. In particular if motion of single targets along the major axis only is of interest (typically upstream/downstream motions), then setting the minor-axis color scheme to "none" will allow visual identification of directions of motion (one direction will be dark to light, the other light to dark). This can be further combined with virtual variable operators to produce highly informative echogram displays.
No alternate color scheme has been developed for minor-axis angle and major-axis angle. It is possible to design alternate color schemes using Echocolor.
Major Axis color scheme
|
|
This is the blue scale color scheme selected by default for the major axis of angle echograms (Colors on the Echogram Display page of the Variable Properties dialog box). See Angular positions color legend.
Minor Axis color scheme
|
|
This is the red scale color scheme selected by default for the minor axis of angle echograms (Colors on the Echogram Display page of the Variable Properties dialog box). See Angular positions color legend.
ASL Environmental Sciences AZFP color scheme
|
|
|
|
Primary color scheme |
Alternative color scheme |
The primary color scheme has been developed for displaying data from ASL Environmental Sciences AZFP echosounders. The primary color scheme interpolates between colors.
The alternate color scheme doesn't interpolate between colors. Press Y when viewing an echogram to see the contrast.
BlueView color scheme
|
|
|
|
Primary color scheme |
Alternative color scheme |
This color scheme has been developed for displaying data from BlueView imaging sonars.
The alternate color scheme provides different background and below threshold colors on the multibeam echogram. Press Y when viewing a multibeam echogram to see the contrast.
Boolean color scheme
|
|
A 127 gray color scheme with a default range of 1 for displaying boolean virtual variables. This color scheme is not automatically applied to boolean variables but can be applied in the Echogram Display page of the Variable Properties dialog box.
No alternate color scheme has been developed for the Boolean color scheme. It is possible to design alternate color schemes using Echocolor.
Default color scheme
Echoview 1.xx color scheme
|
|
|
|
Primary color scheme |
Alternative color scheme |

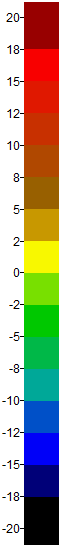
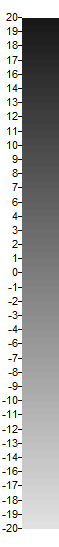
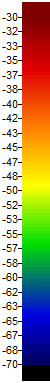
The primary Default color scheme is a three color scheme with 24 shades of each of the colors gray, blue and red, with 1 dB intervals between each shade, giving a dynamic range of 71 dB for the screen display. The alternate color scheme is the same as the Kaijo primary color scheme.
To display echograms with the alternate color scheme, press the Y key with the echogram in focus. Press the Y key again to return the display to the primary color scheme.
This color scheme is also available under the name Echoview 1.xx for backward compatibility with earlier versions of Echoview.
Depth color scheme
|
|
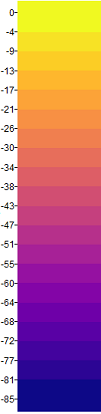
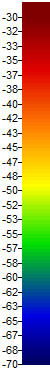
A 256 color scheme. The depth color scheme is particularly useful for alongtrack display of the Mean "exclude below" line depth. In that instance the color legend variable is mean depth in meters.
The alternate color scheme for Depth is the same except that alongtrack displays are displayed with a white background instead of beige.
To display echograms with the alternate color scheme, press the Y key with the echogram in focus. Press the Y key again to return the display to the primary color scheme.
DIDSON color scheme
|
|
|
|
Primary color scheme |
Alternative color scheme |
This color scheme has been developed for displaying data from DIDSON imaging sonars.
The alternate color scheme provides different background and below threshold colors on the multibeam echogram. Press Y when viewing a multibeam echogram to see the contrast.
DT4 color scheme
|
|
|
|
Primary color scheme |
Alternative color scheme |

The primary DT4 color scheme is a 16 color scheme with 4.375 dB intervals between colors. This color scheme has been developed for viewing data recorded from BioSonics echosounders. The alternate color scheme is a gray-scale scheme that can be useful for displaying fish tracks against Sv echograms, for instance.
To display echograms with the alternate color scheme, press the Y key with the echogram in focus. Press the Y key again to return the display to the primary color scheme.
EK500 color scheme
|
|
|
|
Primary color scheme |
Alternative color scheme |
These color schemes have been developed for viewing data recorded from Simrad Ex500, Ex60, Ex70 and ME70 echosounders. The alternate color scheme changes below threshold data from white to black. The alternate color scheme may be preferable for night viewing during surveys.
To display echograms with the alternate color scheme, press the Y key with the echogram in focus. Press the Y key again to return the display to the primary color scheme.
EK80 color scheme
|
|
|
|
Primary color scheme |
Alternative color scheme |


These color schemes have been developed for viewing data recorded from Simrad EK80 echosounders. The alternate color scheme changes below threshold data from white to black. The alternate color scheme may be preferable for night viewing during surveys.
To display echograms with the alternate color scheme, press the Y key with the echogram in focus. Press the Y key again to return the display to the primary color scheme.
EM series color scheme, and
SM2000 color scheme
|
|
This color scheme has been developed for displaying data recorded from Simrad Mesotech SM2000 FR multibeam echosounders and Kongsberg EM series echosounders.
No alternate color scheme has been developed for the SM2000 FR color scheme. It is possible to design alternate color schemes using Echocolor.
EM Series V2
 |
 |
|
Primary color scheme |
Alternate color scheme |
This color scheme has been developed for displaying data recorded from Kongsberg EM series [EM710 and EM3002] echosounders.
SM20 color scheme
|
|
This color scheme has been developed for displaying data recorded from Kongsberg Mesotech SM20 multibeam echosounders.
No alternate color scheme has been developed for the SM20 color scheme. It is possible to design alternate color schemes using Echocolor.
Furuno FQ80
|
|
|
|
Primary color scheme |
Alternative color scheme |
This color scheme has been developed for viewing data recorded from Furuno FQ80 echosounders. The alternate color scheme changes below threshold data from black to white.
Furuno FSV
|
|
|
|
Primary color scheme |
Alternative color scheme |
This color scheme has been developed for viewing data recorded from Furuno FSV echosounders. To display echograms with the alternate color scheme, press the Y key with the echogram in focus. Press the Y key again to return the display to the primary color scheme.
HTI color scheme
|
|
|
|
Primary color scheme |
Alternative color scheme |
These color schemes have been developed for viewing data recorded from HTI echosounders. The alternate color scheme changes below threshold data from deep blue to white.
To display echograms with the alternate color scheme, press the Y key with the echogram in focus. Press the Y key again to return the display to the primary color scheme.
Inferno color scheme
|
|
|
|
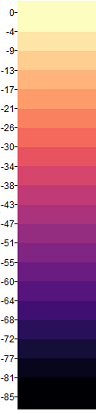
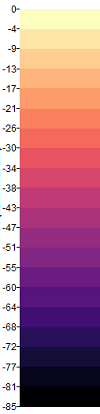
Primary color scheme |
Alternative color scheme |
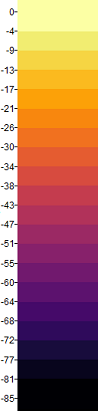
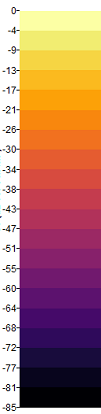
The primary Inferno color scheme is designed and is based on a colormap that represents data in the most visually accurate way given the limitations of monitors, eyes and brain. The alternate color scheme is the same as the primary default color scheme, except for the colors above and below the minimum and maximum thresholds, which are white.
To display echograms with the alternate color scheme, press the Y key with the echogram in focus. Press the Y key again to return the display to the primary color scheme.
Kaijo color scheme
|
|
|
|
Primary color scheme |
Alternative color scheme |
The primary Kaijo color scheme is a 15 color scheme with 3 dB intervals between colors. This color scheme has been developed for viewing data recorded from Kaijo echosounders. The alternate color scheme is the same as the primary default color scheme.
To display echograms with the alternate color scheme, press the Y key with the echogram in focus. Press the Y key again to return the display to the primary color scheme.
Kongsberg Mesotech M3
 |
 |
|
Primary color scheme |
Alternate color scheme |
The primary Kongsberg Mesotech M3 color scheme has been developed for viewing data recorded from Kongsberg Mesotech M3 sonars.
To display echograms with the alternate color scheme, press the Y key with the echogram in focus. Press the Y key again to return the display to the primary color scheme.
Landscape color scheme
|
|
|
|
Primary color scheme |
Alternative color scheme |
This color scheme has been developed for use in 3 dimensional scenes depicting landscapes (above water surface scenes) - a snowy white at the highest altitude (lowest depth) and a marine blue at the lowest altitudes (highest depths). The alternate color scheme is the reverse of the primary.
To display echograms with the alternate color scheme, press the Y key with the echogram in focus. Press the Y key again to return the display to the primary color scheme.
Magma color scheme
|
|
|
|
Primary color scheme |
Alternative color scheme |
The primary Magma color scheme is designed and is based on a colormap that represents data in the most visually accurate way given the limitations of monitors, eyes and brain. The alternate color scheme is the same as the primary default color scheme, except for the colors above and below the minimum and maximum thresholds, which are white.
To display echograms with the alternate color scheme, press the Y key with the echogram in focus. Press the Y key again to return the display to the primary color scheme.
Monochrome (Gray, Gray reversed, Red, Green and Blue) color schemes
|
|
|
|
|
|
These color scheme provide simple monochrome scales for rendering echograms in a single color. No alternate color schemes are provided with these. It is possible to design alternate color schemes using Echocolor.
Multibeam phase color scheme
|
|
|
|
Primary color scheme |
Alternative color scheme |
This is a scale which starts where it ends (in blue) in order to represent a complete circle. The lowest value represents -π and the highest π on a multibeam phase echogram, which is in fact the same value.
This color scheme has been developed for displaying data from multibeam phase variables recorded from Simrad SM2000 series multibeam echosounders.
NASC and ABC color scheme
|
|
The NASC and ABC color scheme has been developed for alongtrack displays of NASC and ABC. Default values for NASC and ABC displays may not be the optimum for some alongtrack displays. Echoview Software recommends that you integrate selections on the echogram you are using for alongtrack display to determine the best range of values. Alternatively, use the Cruise track keyboard shortcuts to change the color minimum and range to suit your purposes.
The alternate color scheme for NASC and ABC is the same except that alongtrack displays are displayed with a white background instead of beige.
To display echograms with the alternate color scheme, press the Y key with the echogram in focus. Press the Y key again to return the display to the primary color scheme.
Plasma color scheme
|
|
|
|
Primary color scheme |
Alternative color scheme |
The primary Plasma color scheme is designed and is based on a colormap that represents data in the most visually accurate way given the limitations of monitors, eyes and brain. The alternate color scheme is the same as the primary default color scheme, except for the colors above and below the minimum and maximum thresholds, which are white.
The alternate color scheme provides different background and below threshold colors on the multibeam echogram. Press Y when viewing a multibeam echogram to see the contrast.
RESON Snapshot color scheme
|
|
|
|
Primary color scheme |
Alternative color scheme |
This color scheme has been developed for displaying data from snapshot files recorded from RESON 8000 series multibeam echosounders.
The alternate color scheme provides different background and below threshold colors on the multibeam echogram. Press Y when viewing a multibeam echogram to see the contrast.
Seascape color scheme
|
|
|
|
Primary color scheme |
Alternative color scheme |
This color scheme has been developed for use in 3 dimensional scenes depicting seascapes (underwater scenes) - an earthy brown at the highest altitude (lowest depth) and a marine blue at the lowest altitudes (highest depths). The alternate color scheme is the reverse of the primary.
To display echograms with the alternate color scheme, press the Y key with the echogram in focus. Press the Y key again to return the display to the primary color scheme.
Simrad scanning color scheme
Prior to Echoview 5.3, also known as the Simrad SP70 and SH80 color scheme.
|
|
|
|
Primary color scheme |
Alternative color scheme |
These color schemes have been developed for viewing data recorded from Simrad scanning sonars. The Primary color scheme is based on Simrad's normal color scheme titled "Day Black". The Alternate scheme is based on Simrad's (weak) color scheme titled "Bright Day". Both schemes include the color for Simrad No-data.
To display echograms with the alternate color scheme, press the Y key with the echogram in focus. Press the Y key again to return the display to the primary color scheme.
Sonic color scheme
|
|
Primary color scheme |
Alternative color scheme |
These color schemes have been developed for viewing data recorded from Sonic KFC-6000/KSE-300 echosounders.
To display echograms with the alternate color scheme, press the Y key with the echogram in focus. Press the Y key again to return the display to the primary color scheme.
Speed color scheme
|
|
|
|
Primary color scheme |
Alternative color scheme |
These color schemes have been developed for use with virtual echograms produced by the Vessel speed at pings operator. For the Primary and Alternative color schemes below threshold values (including where no speed is available) are displayed in white.
To display echograms with the alternate color scheme, press the Y key with the echogram in focus. Press the Y key again to return the display to the primary color scheme.
Velocity color scheme
|
|
|
|
Primary color scheme |
Alternative color scheme |
These color schemes have been developed for viewing data recorded from ADCP devices measuring water current velocity.
To display echograms with the alternate color scheme, press the Y key with the echogram in focus. Press the Y key again to return the display to the primary color scheme.
Viridis color scheme
|
|
|
|
Primary color scheme |
Alternative color scheme |
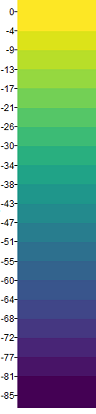
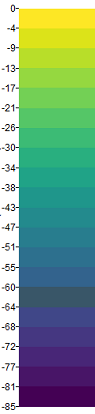
The primary Viridis color scheme is designed and is based on a colormap that represents data in the most visually accurate way given the limitations of monitors, eyes and brain. The alternate color scheme is the same as the primary default color scheme, except for the colors above and below the minimum and maximum thresholds, which are white.
To display echograms with the alternate color scheme, press the Y key with the echogram in focus. Press the Y key again to return the display to the primary color scheme.
WASSP NWSF color scheme
|
|
|
|
Primary color scheme |
Alternative color scheme |
The Primary WASSP color scheme is designed to display pings that are recorded as Device calibrated: true in the *.nwsf data file. The Alternative WASSP color scheme replaces black with white for below minimum values to make region outlines more visible. See also WASSP data files.
To display echograms with the alternate color scheme, press the Y key with the echogram in focus. Press the Y key again to return the display to the primary color scheme.
Custom color schemes
You can create custom color schemes using Echocolor. Built-in color schemes can be overwritten by creating a custom color scheme with the same name. If a built in color scheme is overridden then "(.evc file)" will be appended to its name in the list on the Echogram Display page of the Variable Properties dialog box. For example if you save a color scheme EK500.evc in your color Schemes folder, then the EK500 color scheme will appear as "EK500 (.evc file)" in this list. For the 64-bit Echoview edition, the default location for color schemes is typically in
- C:\Users\Public\Documents\Echoview Software\Echoview N\Color schemes
where N is the Echoview version number. Be aware that any change to the file location will not come into effect until Echoview is restarted.
See also
Color legend dialog box
Variable Properties dialog box - Echogram Display page
Scene Properties dialog box - General page