About Cruise Tracks
A cruise track represents geographic position data in a position variable, optionally combined with the data from an acoustic variable or a bottom points variable. The types of cruise tracks in Echoview are:
See also
- Cruise track display controls
- What is plotted where?
- Using cruise tracks: Define and integrate a region
- Using cruise tracks: Displaying map and waypoint data
- Adding waypoint files: Displaying a WMS map
- Using cruise tracks: Calculating the area of a polygon
GPS fixes
GPS fixes cruise tracks are created from position variables and provide information on the status of the GPS data.
To display a GPS fixes cruise track, do one of the following:
- On the View menu, point to Cruise Track, and then click a position variable.
Note: If you have created multiple filesets you will need to point to the Fileset that derived the raw variable of interest. - On the Filesets window; double-click a position variable, or select a position variable and click Cruise Track.
- On the Dataflow window; double-click a position variable icon, or right-click on a position variable icon then click Cruise Track
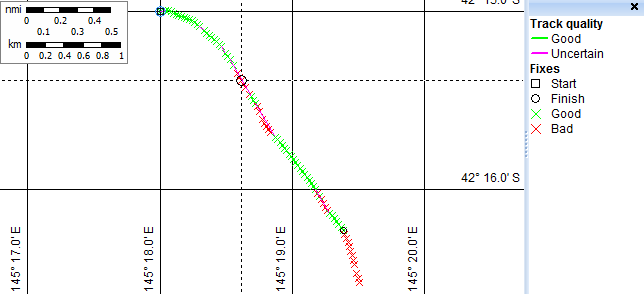
GPS fixes are displayed in the following way:
- The first fix is displayed as a small black or gray square (top left in the example).
- The last fix is displayed as a small black or gray circle (near bottom right in the example).
- Display of fix and track quality.
Notes:
- If the cruise track is synchronized with an echogram or table, the GPS fix selected on the echogram is shown by a black circle and crosshair (towards the top left in the example). You can also double-click on a point on an echogram, or a row in a table, and view that point on the synchronized echogram.
- When you move the mouse along the cruise track, the GPS fix closest to the mouse is tracked by a small blue circle (shown adjacent to the mouse in the example).
- Cruise tracks are created from processed GPS fixes. You enter processing settings on the Data page of the Variable properties dialog box. Good and Bad fixes are only displayed if selected on the Cruisetrack Display page of the Variable Properties dialog box.
- For further information see About GPS fix status and Processing and smoothing cruise tracks.
- To smooth a cruise track you must create a virtual position variable using the Kalman GPS smoothing filter operator. See Processing and smoothing cruise tracks for more information.
- Cruise tracks plot the position of the GPS antenna, the position of the platform may be offset from the position of the GPS antenna as defined via the Platform Properties dialog box.
- Position status is also shown on the position status bar on an echogram.
- The coordinate system used on cruise track windows may be either latitude/longitude or eastings/northings. This is determined by the Map Projection selected on the Mapping page of the EV File Properties dialog box.
- Regions can be created and region nodes edited.
- The alongtrack length or area of regions may be displayed in the Echoview status bar.
See also
Using cruise tracks
Processing and smoothing cruise tracks
Adding map and Waypoint files to cruise tracks windows
Cruise track keyboard shortcuts
Determining GPS fix status
Determining Ping position status
Mouse pointer duplication
Bottom classification display
A bottom classification produces a bottom points variable that contains geographic and bottom points data. The bottom points cruise track may be used to display bottom point class in alongtrack or point style. The bottom points cruise track can be auto-synchronized with a bottom points table, bottom points integram, echograms and Media window. From more information refer to About bottom classification.
To display a bottom points cruise track, do one of the following:
- On the View menu, point to Cruise Track, and then click a bottom points variable.
- On the Dataflow window, right-click on a bottom points variable then click Cruise Track.
Alongtrack display
Alongtrack display is a color-coded cruise track showing integration or other processing results derived from an acoustic variable. For example, it is possible to create a cruise track showing the depth of the sea floor, or the mean Sv value, as seen below. Alongtrack displays can only be created from raw or virtual variables with a data type of Sv. For instructions, refer to Using cruise tracks: Displaying an alongtrack display cruise track and Alongtrack Display settings.
To display an Alongtrack display, do one of the following:
- On the View menu, point to Cruise Track, and then click an acoustic variable.
Note: If you have created multiple filesets you will have to point to the Fileset that derived the raw variable of interest. - On the Filesets window, select an acoustic variable and click Cruise Track.
- On the Dataflow window, right-click on an acoustic variable icon then click Cruise Track.
Analysis results that can be output to an alongtrack display are:
- Mean Sv
- Minimum Sv
- Maximum Sv
- NASC (nautical area scattering co-efficient)
- ABC (area backscattering co-efficient)
- Area backscattering strength (10logABC)
- Mean "exclude below" line depth
- ping status
To select analysis results for output to an alongtrack display, see Using cruise tracks: Alongtrack display.
Each segment on the cruise track shows the mean value of the selected analysis variable calculated across a range of pings. The range of pings for each segment is determined by the time/distance grid settings in the Variable Properties dialog box and can be based on time, distance, or number of pings. In the above example, each segment in the cruise track shows the mean Sv for every 20 pings of data.
Notes:
- Calculation of results for alongtrack display is also affected by all Echoview settings that affect processing such as data thresholds, exclusion lines, and bad data regions. See About setting variable properties for a detailed description of how Echoview settings affect output.
- The alongtrack display plots the position of the transducer that has been applied to the Sv variable on the Calibration page of the Variable Properties dialog box. If the transducer position varies from the GPS antenna position then the alongtrack display will vary from the cruise track of GPS positions.
- An alongtrack display of ping status is not affected by the time/distance grid setting. The intervals displayed on the cruise track are the same as the intervals set on the echogram.
- The coordinate system used on cruise track windows may be either latitude/longitude or eastings/northings. This is determined by the Map Projection selected on the Mapping page of the EV File Properties dialog box.
- Displayed or created regions can be integrated.
- The alongtrack length or area of regions may be displayed in the Echoview status bar.
See also
3D cruise tracks
3D cruise tracks are a 3D object which can be added to scenes.
The 3D cruise track plots the position of the GPS antenna. See About transducer geometry for further information about how the position of the GPS antenna is specified.
See Displaying a 3D cruise track and Using a 3D cruise track for scene animation for further information.
Cruise track display controls
For EV file wide map-based color and thickness properties use the Cruisetrack Display page of the EV File Properties dialog box.
For variable-based properties use Cruisetrack Display or Alongtrack Display settings.
What is plotted where?
Each cruise track plots the course of a slightly different point of the echosounder system:
| Track type | Position |
| GPS fix cruise tracks | GPS antenna |
| 3D cruise tracks | GPS antenna |
| alongtrack display cruise tracks | transducer |
| bottom classification display | transducer |
The About transducer geometry page contains more information on how the GPS and transducer positions interrelate.
See also
Using cruise tracks
Processing and smoothing cruise tracks
Adding map and Waypoint files to cruise tracks windows
Cruise track keyboard shortcuts
About color schemes
About setting variable properties
Export positions
Echoview Status bar