Cell Statistic or Cell Statistic [Single targets]
Cell Statistic
This operator outputs a variable where a cell's sample values are set to a nominated cell statistic calculated from the input operand. Cells are defined by the Grid page of the operator. The cell statistic and associated settings can be selected on the Cell Statistic page of the Variable Properties dialog box. Further information is available under Cell statistic algorithms and About the Cell statistic operator.
Echoview accepts operands of the following data type as input:
- Sv
Note: Under live viewing, the Live Export based on a Cell statistic variable may be limited.
Cell Statistic [Single targets]
This operator outputs a variable where a cell's sample values are set to a nominated cell statistic calculated from the input operand. Cells are defined by the Grid page of the operator. The cell statistic and associated settings can be selected on the Cell Statistic page of the Variable Properties dialog box. Operand 2 provides the geometry for the output pings. There is a requirement that operand 1 and 2 pings times match. Further information is available under Cell statistic algorithms and About the Cell statistic operator.
Echoview accepts operands of the following data type as input:
Operand 1
- Single targets
Operand 2
- Angular position
- Boolean
- Color
- Linear
- Power dB
- Pulse compressed complex angular position
- Sv
- TS
- Unspecified dB
Notes:
- Under live viewing, the Live Export based on a Cell statistic variable may be limited.
- All ping timestamps in Operand 1 must have an identical match in Operand 2.
Settings
The Cell Statistic Variable Properties dialog box pages or the Cell Statistic [Single targets] Variable Properties dialog box pages include (common) Variable Properties pages and these operator pages:
Operands page
Cell statistic page
Note: No data samples are ignored under all algorithms. The treatment of thresholded samples is specified by the selected Cell statistic algorithm.
Statistic
|
Settings |
Description |
|||||||||||||||||||||||||||
|
Algorithm |
Available Cell statistic algorithms are selected from the Algorithm list.
|
|||||||||||||||||||||||||||
|
Fill empty cells with the mean value of surrounding cells |
Select this setting to fill empty cells with the mean value of surrounding cells. Clear this setting to leave empty cells empty.
Mean calculationThe mean is calculated by considering the original cell values of the nearest-neighbor cells (up to 8 cells). Cells that have a no-data value do not contribute to the mean calculation (in the numerator or divisor). |
Algorithm
The Cell statistic operator accepts gridded Sv data and outputs a virtual variable with the same grid; each cell's samples are set to a selected cell statistic.
The Cell statistic [single targets] operator accepts two operands. Operand 1 provides the gridded single target data. Operand 2 provides the ping geometry. The output is a virtual variable with the same grid and a specified ping geometry; each cell's samples are set to a selected cell statistic.
Cell statistic settings specified on the Cell statistic page of the Variable Properties dialog box. When required, Cell statistics are converted to the linear domain for intermediate calculations with output values reconverted to the dB domain. Excluded and thresholded samples affect the calculations of the cell statistic. No data samples affect the calculations for the setting Fill empty cells with the mean value of surrounding cells of the Cell Statistic operator.
About the Cell statistic operator discusses uses of these Cell statistic operator.
Notes:
- Under live viewing, the Live Export based on a Cell statistic variable may be limited.
- Data in cells is subject to boundary rules.
The diagram below shows gridded input operand samples and the output cell statistic.
|
Operand 1
|
Cell statistic variable
|
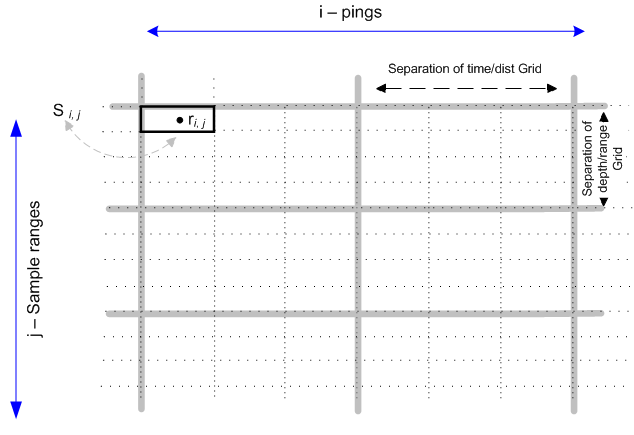
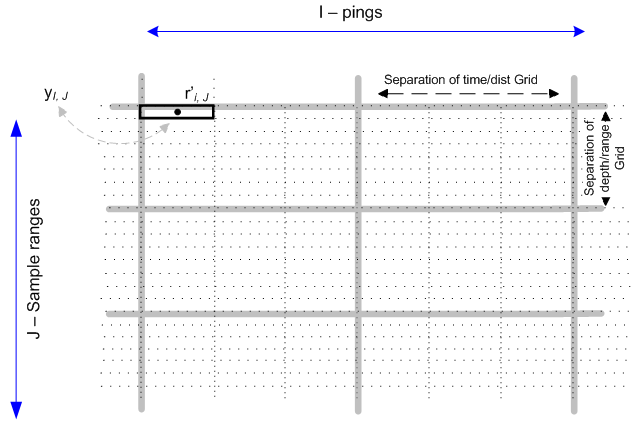
Where:
i is the index for pings in Operand 1. I is the index for the pings in the Cell statistic variable. The number of pings is unchanged by the operator i.e.i = I. j is the index for samples in an Operand 1 ping := {0 ... n-1} J is the index for samples in a Cell statistic output ping := {0 ... m-1}
n is the number of samples in an Operand 1 ping m is the number of samples in the Cell statistic ping
When Operand 1 is Sv m = n When Operand 1 is Single target
m = the ping geometry from Operand 2
A is the set of all samples in an Operand 1 cell. Samples in set A can be referred as sample s and denoted as
s i,j. Eligible samples from set A are specified by the algorithms (below). The set for eligible samples is referred to as A'.Y is the set of all samples in the Cell statistic cell. Samples in this set are denoted by yI,J (cell). Separation of time/distance Grid is the separation displayed under Show time/dist grid on the Grid page of the Variable Properties dialog box of Operand 1. Cells for the Cell statistic variable are defined by the Grid for Operand 1.
Separation of depth/range Grid is the separation displayed under Show depth/range/line-referenced grid on the Grid page of the Variable Properties dialog box of Operand 1. Cells for the Cell statistic variable are defined by the Grid for the Operand 1.
Operations
The operations available can be divided into two groups, mean statistics and sampled statistics. They are described individually below:
Mean
Samples within Operand 1's cells contribute to the Mean for each cell. In the Cell statistic variable the samples, yi,J (cell), are set to the associated Mean from Operand 1.
Let A be the set of samples s, in the Operand 1 cell, over which the (Sv or TS) Mean is calculated.
The sample values in the output cell are set to:
yI,J (cell) = 10 log (sv (Operand 1 cell))
Calculations are performed in the linear domain not the decibel domain. See Conversions for details.
This calculation is used for calculating the Mean for each cell of the input operand:
Where:
= the value of sample J in output ping Iin a cell of the Cell statistic variable = the linear mean Sv for all samples or the linear mean TS for all single targets in A (m2/m3) - see Conversions. = the set of all eligible samples in the Operand 1 cell.
- No-data samples are ignored.
- Thresholded samples are ineligible and are not used for the Mean calculation.
svs = the linear Sv value for sample s (m2/m3) or the linear TS value for sample s - see Conversions. N = the number of eligible samples in the Operand 1 cell Refer to the introductory diagram above for definitions of any remaining symbols.Sampled statistics
Minimum
In the Cell statistic variable the samples, yI,J (cell), are set to the corresponding cell's Minimum value from Operand 1.
yI, J (cell) = W0
Where:
yI, J (cell) = the value of sample J in output ping Iin a cell of the Cell statistic variable = the value for Sv minimum - or - the value for TS minimum
Where W is the ordered list of sample values si, j for all i,j in set A, being (W0, W1, W2, .... WN-1) such that Wi ≤ Wi+1
and N is the number of samples in the list.
Such that:
- Thresholding is ignored and those samples' values are part of set A.
- No-data samples are ignored.
Refer to the introductory diagram above for definitions of any remaining symbols.
Maximum
In the Cell statistic variable the samples, yI,J (cell), are set to the corresponding cell's Maximum value from Operand 1.
yI, J (cell) = W0
Where:
yI, J (cell) = the value of sample J in output ping Iin a cell of the Cell statistic variable W0 = the value for Sv maximum - or - the value for TS maximum
Where W the ordered list of sample values si, j for all i,j in set A, being (W0, W1, W2, .... WN-1) such that Wi ≥ Wi+1
and N is the number of samples in the list.
Such that:
- Thresholding is ignored and those samples' values are part of set A.
- No-data samples are ignored.
Refer to the introductory diagram above for definitions of any remaining symbols.
Median
In the Cell statistic variable the samples, yI,J (cell), are set to the corresponding cell's Median value from Operand 1.
yI, J (cell) = Wk if N is odd (W k+Wk+1)/2 if N is even Where:
yI, J (cell) = the value of sample J in output ping I in a cell of the Cell statistic variable. Wk = the value of sample k in the list W — (defined below) k = ëN/2û * N = the number of eligible samples in the list W A' = the set of all eligible samples in the Operand 1 cell.
- No-data samples are ignored.
- Thresholded samples are ineligible and are not used for the Median calculation.
W = the ordered list of sample values si, j for all i,j in set A', being (W0, W1, W2, .... WN-1) such that Wi ≤ Wi+1
Refer to the introductory diagram above for definitions of any remaining symbols.
Percentile
In the Cell statistic variable the samples, yI,J (cell), are set to the corresponding cell's Nth Percentile score from Operand 1.
yI, J (cell) = Wk + (Wk+1 - Wk) (k' - k)
Where:
yI, J (cell) = the Nth Percentile score for sample J in output ping I in a cell of the Cell statistic variable. The operand's data type outputs Sv cell percentile or Single target cell percentile. Wk = the value of sample k in the list W — (defined below) k = ëk'û * k' = N x P/100 N = the number of eligible samples in the list W. P = the Nth Percentile entered on the Cell statistic page of the Variable Properties dialog box A' = the set of all eligible samples in the Operand 1 cell.
- No-data samples are ignored.
- Thresholded samples are ineligible and are not used for the Percentile score calculation.
W = the ordered list of sample values si, j for all i,j in set A', being (W0, W1, W2, .... WN-1) such that Wi ≤ Wi+1 Refer to the introductory diagram above for definitions of any remaining symbols.

Number of samples or Number of single targets
In the Cell statistic variable, the samples yI,J (cell) are set to the corresponding cell's No. of samples or No. of single targets from the input operand.
| The algorithm | Eligible samples for the Number calculation: |
| No. of samples is calculated in a way similar to the Integrate Cell feature for Sv data. |
|
| No. of single targets is calculated in a similar way to the Analyze Cell feature for single target data. |
Beam volume sum
In the Cell statistic variable, the samples yI,J (cell) are set to the corresponding cell's Beam volume sum (m3) from the input operand. The input operand cell defines the calculation domain for the Beam volume sum algorithm as used by the Integrate cell feature for Sv data or the Analyze Cell feature for single target data.
Echoview uses a single target beam volume angle that is based on the single target Variable Properties. See also: Single target beam volume angle and across-track beam angle prior to Echoview 13.1
Echo density
In Cell statistic variable, the samples yI,J (cell) are set to the corresponding cell's Echo density from the input (single target) operand. The units are number of single targets per cubic meter.
From Echvoiew 13.1, Echoview uses a better estimate for the single target Beam volume angle used by the Beam volume sum algorithm. Please review and possibly reassess earlier Echoview single target Beam volume sum values and consider their impact on Echo density.
The Echo density is calculated in this way:
Echo density = No. of single targets / Beam volume sum
Echo density can be used in Density index calculations for Nv and M.
Footnote:
*Floor function ëxû, gives the largest integer less than or equal to x.