Working with a submerged platform
Echoview supports a submerged platform with positioned transducers. To configure platform and transducer geometry in Echoview, data associated with the platform and transducer(s) is required. Then echogram display and grid settings can orient and add depth or range context to displayed data.
A submerged platform has a vertical position below a water surface at 0 meters in depth.
Scenario: Fixed transducer pointed up and mounted at a depth of 300 m
This dataset is from an single beam instrument mounted at 300m in the Strait of Georgia (between Vancouver Island and the mainland) and looking upward. There is a mid-depth scattering layer, a diurnal vertical migrating layer and various fish targets. Data shared by David Lemon, ASL Environmental Sciences Inc.
The TVG affected background noise is removed and a Viridis colormap is used. The following Platform-Transducer approach is used because the details of the fixed platform are not available. Tthe water surface is not detected and the echograms include a gap before 0 m of depth, as a visual reminder. The single beam system does not require a value for Beam rotation when the transducer points up. Note, a split-beam system does require a value of 180° for the Beam rotation, in order to orient the transducer minor axis for single target detection and fish tracking.
Platform Properties dialog box, Position page:
- Platform type = Fixed
- Latitude and longitude of the fixed platform.
- Altitude of fixed platform = -310 m.
- Z coordinate of water level = -310 m.
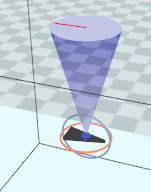
Transducer Properties dialog box, Geometry page:
- Elevation = 180°.
- Z-vertical offset = -1 m.
Variable Properties dialog box:
- Echogram Display page, Flip echogram vertically. This setting is used to visually orient the echogram data. A visual cue is the transducer ringing, as displayed by the magnified inset of Figure 3.
- Grid page, Show depth/range/ line-reference grid: Water surface (depth of zero) or Transducer face (range of zero)
EV File Properties dialog box, Echogram page, Echogram Mode is Depth or Range.
|
Figure 1: Transducer Geometry Properties for Strait of Georgia data. |
Figure 2: Echogram Mode is Depth, the depth grid is referenced to the water surface where depth is 0m.
Figure 3: Echogram Mode is Range, the range grid is referenced to the range from the transducer face range at 0m.
|

Scenario: Moving glider or AUV with a transducer pointed up and a transducer pointed down
This dataset was collected using an EK80 Mini from an autonomous underwater vehicle (AUV). Two pairs of multiplexed Simrad transducers were attached to a passively-moving gimbal that maintained their orientation, with one set of transducers looking upward and one downward as the vehicle undulated through the water. Data shared by Chad Waluk and Kelly Benoit-Bird at the Monterey Bay Aquarium Research Institute, USA.
Transient noise removal and Impulse noise removal operators were used to preprocess the data.
Platform Properties dialog box, Position page:
- Platform type = Position determined by GPS.
- Position source = GPS position variable.
- Altitude of system reference point = 0 m.
- In this case the altitude of the platform is handled by the Heave source.
- Z coordinate of the water level = 0 m.
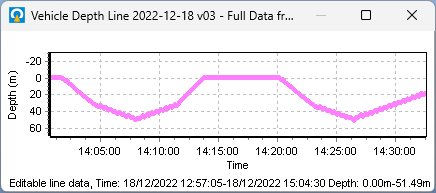
- Heave source = Line variable.
- Heave compensation is useful for a fixed or moving transducers.
Transducer
Fileset Properties dialog box
Where data from more than one transducer is recorded, raw variables can be derived with respect to a transducer or channel number. For new filesets use the Fileset Properties dialog box method for deriving acoustic raw variables, Using transducer/channel number.
View the Channel 1 and 2 echograms to determine which channel corresponds to the transducer pointing down. Visual cues may help you to determine the data recorded with the transducer pointed down and up. Look for matching or known features, ringing at the transducer face and the strong signal at the bottom. At the water-air interface the data may include strong noise within a ping. Data above the water surface that can be excluded at a later stage of processing.
Dataflow window
All the raw acoustic variables regardless of channel are associated with the initial transducer (T1) created when the data files were added to the filest.
- On the Dataflow window use the shortcut (right-click) menu to select New, Transducer.
- Click OK.
Transducer Properties dialog box
Use the Transducer Properties dialog box to configure the transducer pointing down with an Elevation = 0°.
Use the Transducer Properties dialog box to configure the transducer pointing up with an Elevation = 180°.
Channel 1 variables are assigned to the T1 transducer by default. On the Dataflow window, to assign the second transducer, drag and drop from the appropriate transducer to the Channel 2 acoustic variables.
Variable Properties dialog box
- Grid page, Show depth/range/ line-reference grid: Water surface (depth of zero) or Transducer face (range of zero)
- Echogram Display page, Flip echogram vertically. This setting can visually orient the echogram data. A transducer visual cue is the ringing at the face of the transducer, see the magnified inset in Figure 3.
- Echogram Display page, Echogram display limits can be used to finesse the display of upward pointing data.
 i
i
Figure 4: Vehicle depth line.
![]()
Figure 5: Echogram of upward pointing transducer. Note the strong noise within pings at the water-air interface where the depth is 0 m. Display limits are set to automatic.
![]()
Figure 6: Echogram of downward pointing transducer.
A single visualization
Use the Join opposing pings operator to create a water column dataset.
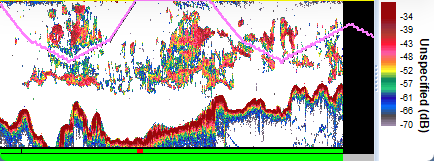
Figure 7: The Join opposing pings echogram displays a synthesized water column data set when the Echogram mode is specified as Depth. The display limits are manually specified for 0 m depth to the depth of the downward transducer data. The virtual variable has positive and negative range values relative to operand 1.
Platform with a towed body.
For a platform towing a body with a downward pointing transducer, Echoview offers the Towed body operator. See also Synchronizing towed body media with echograms.
See also
About platforms
Platform Properties dialog box
Transducer Properties dialog box
Variable Properties dialog box
EV File Properties dialog box, Echogram page
About Transducer geometry
About Beam geometry