About multibeam echograms
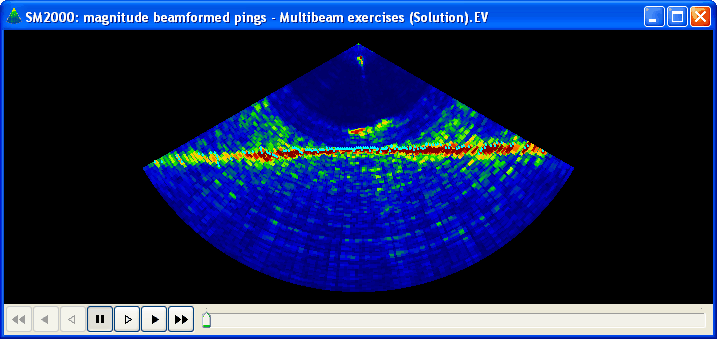
A multibeam echogram is a visual representation of data captured from a multibeam echosounder. Multibeam data can be displayed in the form of a sector plot which represents data from a single ping only. The pings can be navigated with the controls beneath the echogram.
An example multibeam echogram is displayed below.

For ping modes 2, 3, 4 and 5 (H, V or S-mode) this sector represents a fan seen from one side. For ping mode 3 (H-mode) it is depicted as a full circle and represents a cone seen from above and will include a vessel icon and line drawn in the direction of vessel heading (the orientation of the echogram can be selected). See About ping modes, for more information.
Beam details, data file, geographic position and date and time of ping immediately under the mouse cursor are displayed on the status bar. See Echoview status bar for more information.
Regions and surfaces may also be displayed on multibeam echograms. See About intersections for further information.
Note: Multibeam data may also be displayed in a 4D window or a scene window
- Multibeam echogram replay
- Beam selection
- Roll correction
- Measuring the distance between two points
- Multibeam bottom preview
- Multibeam display
- Copy to clipboard
Multibeam echogram replay
The multibeam echogram is controlled using the buttons located on the bottom left corner of the echogram window:
|
|
Fast reverse |
|
|
Reverse play at logging rate |
|
|
Back one ping |
|
|
Play/Pause |
|
|
Forwards one ping |
|
|
Replay at logging rate |
|
|
Fast forward |
The time slider can be dragged to display a ping.
The replay rate is selected on the Echogram page of the EV File properties dialog box. On the active echogram toggle between the replay rate selections by pressing Ctrl+M. The replay rate is also displayed on the Details dialog box.
These controls are also used with looped multibeam replay settings when Looped Multibeam Replay is selected on the Shortcut menu on an active single beam echogram.
Beam selection
You can view the individual beams from a multibeam variable as standard echograms by creating a virtual variable using the beam select operator.
To create a virtual variable using the beam select operator:
-
Click the Dataflow tool

- OR -
On the View menu, click Dataflow. -
On the Shortcut menu (right-click), click New, then Variable.
-
Enter a Name for the variable.
-
In the Operator group list click Multibeam operators.
-
In the Operator list, click Beam Select.
-
Click OK; the Variable Properties dialog box for the new variable will open.
-
In the Operand 1 list, select an operand (the required multibeam variable).
-
Click the Beam select tab.
-
In the Beam number box, enter the beam you want displayed when you first view the echogram.
-
Click OK.
To view the echogram of the individual beams:
-
In the Dataflow window, double-click the beam select virtual variable.
-
To change the beam that is displayed:
Press Ctrl+F7 (increment) and Ctrl+F8 (decrement) one beam at a time.
- OR -
On the Beam Select page of the Variable Properties dialog box, enter the required beam number.
Notes:
- Pings will not be included if the specified beam is horizontal or the tilt angle of the ping is different to that of the first ping in the input operand.
- The beam select operator will only return beams which have the same orientation (and that orientation is not horizontal). Roll correction can affect the orientation of beams ping for ping. If roll correction is applied then the beam select operator is unlikely to return more than the first ping. See Roll correction below for further information.
- The depth/range relationship is evaluated in a different way for a beam select virtual variable.
Roll correction
If you have roll data available, you can use this data to correct multibeam echograms. You must use the Multibeam roll at transducer operator to do this.
The Multibeam roll at transducer operator will associate roll with each multibeam ping. This is visible on the resulting multibeam echogram, as the echogram visibly rolls in response to the roll data. The roll data itself can be seen on a roll graph.
All pings in a single beam echogram currently have a single orientation. As a consequence of this, the beam select operator, which produces a single beam echogram from a multibeam echogram, will not operate as intended on roll corrected data (more accurately, on any multibeam data in which the beams in subsequent pings do not have the same orientation). If roll correction is applied in Echoview, then the beam select operator will not function at all. If roll correction is applied by your echosounder, the beam select operator may not produce the results you expect.
The angle select operator is provided to produce a single beam echogram, selecting beams overlapping with a specified angle from the vertical for each subsequent ping. It can therefore produce a valid single beam echogram (in which each of the pings has the same orientation) with an angular error limited to half the displayed width of the single beam on the multibeam echogram which is selected.
Measuring the distance between two points
You can use the Tape measure tool  on the Echogram tools toolbar to measure the two-dimensional distance between two or more points on a multibeam echogram. Such a measurement can be stored with a detected multibeam target. Refer to Measuring distance between two or more points for more information.
Show multibeam bottom preview
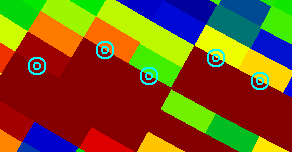
A preview of the samples in the multibeam pings is used in the detection of a bottom surface, the visual is useful while tuning the detection settings.
Show multibeam bottom preview is selected under the Multibeam section on the Echogram Display page of the Variable Properties dialog box.
You can also export bottom preview sample data to a .csv file.
Multibeam bottom preview
Concentric circles indicate each sample which is detected as the bottom peak.

Multibeam display
You can display the direction of the beam numbering and flip the multibeam display horizontally and vertically using the settings on the Display page of the Variable Properties dialog box.
In Echoview, Platform Properties configure the position and attitude of the platform upon which the multibeam transducer is mounted. Transducer Properties configure the location and orientation of the transducer on a platform. Such settings may fail to replicate the view of the multibeam ping as seen in your sonar's software. If this is the case, the multibeam display settings will allow you to replicate the view you want. For more information refer to Sound Metrics notes.
See also Multibeam echograms while live viewing and synchronizing 3D regions.
See also
About virtual variables
Detecting (bottom) surfaces
New variable dialog box
Dataflow window
Variable Properties dialog box
Multibeam echogram keyboard shortcuts
Echogram interpretation
Virtual variable applications
Operators that accept multibeam data
Navigating Echoview
Echogram navigation