About cells
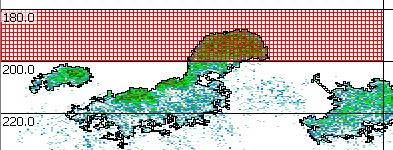
The cells on an echogram are the resulting grids formed by the lines to demarcate time and range spans.
Setting up cells for an echogram
Echoview currently supports cells for single beam echograms.
To set up cells visit the Grid page of the Variable Properties dialog box and specify the
- span between vertical lines (a.k.a intervals) with the Show time/distance grid setting
(Note that transects in an active transect group affect the intervals. Refer to transects and intervals.)
- span between horizontal lines (a.k.a layers) with the Show depth/range/line-referenced grid setting
Using cells
Cells form the analysis domain for on screen and export analysis by cells or analysis by region by cells.
For instance, the red analysis-hatching in this figure indicates that an on-screen integration or on-screen analysis has been completed for that particular cell.

You also use cells for the cell statistic operator.
See also
Integrating cells
Exporting cell analyses
About analysis variables
About interval and layer numbers that identify cells