Essentials module
The Essentials module allows you to:
- Read data and display echograms from supported systems.
- Detect the bottom and define other reference lines.
- Create 3D digital terrain models of the seabed and displays of 3D map data.
- Perform basic quality control and conduct data analyses before exporting the results for use elsewhere.
Note: If your format is not already supported, Echoview is able to read data written to the Echoview Data File Format. Please contact Echoview support to obtain the Echoview Data File Format Definition document and to discuss adding support.
If you have questions about this module, any of its features or would like to discuss pricing, please contact info@echoview.com.
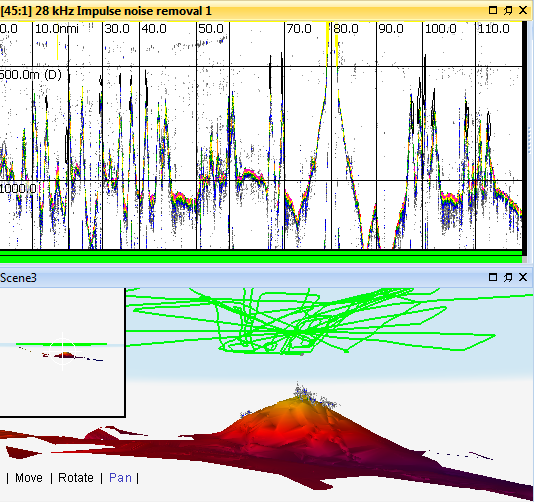
Figure 1. Single beam data with impulse noise removed, and the associated cruise track around a sea mount. The echogram shows all data using the Zoom to Extents feature. The scene displays a water surface, cruise track, a surface created from the bottom line (that outlines the sea mount) and an echogram curtain showing fish schools around the sea mount. The impulse noise removal operator is used under demonstration mode.
Figure 2. A 4D window with ME70 georeferenced samples depicting a rockfish school in multibeam data. The green line represents the cruise track. Changes in the display threshold reveal schools. The 4D window allows you to zoom, rotate around samples and pan.
Specific features
- Data files and echograms
- Cruise track and maps
- Transects
- Scenes
- Lines
- Surfaces
- Regions
- Analysis of Sv and single target data
- Graphs
- Operators
- Export
Data files and echograms
- Unrestricted number of data files that can be loaded at one time.
- Unrestricted viewing of single beam or multibeam data.
- Seamless viewing over data file boundaries.
- Re-set calibration parameters in post processing.
- No restriction on the resolution of data or number of samples per ping.
- Display data from multiple echosounders and multiple frequencies at the one time.
- Rapid echogram scrolling forwards and backwards.
- Multiple step zooming tools to see data at any level of detail (up to individual samples).
- Rapid adjustment of echogram thresholds.
- View multiple variables (channels) at one time (e.g. TS, phase and detected single targets).
- Instant synchronization of multiple echogram displays.
- Designate "bad data" or "empty water" areas for exclusion from the echo integral.
- Display echogram relative to a specified reference line.
- Print from echograms, cruise tracks and other windows.
Cruise track and maps
- Display cruise track (from GPS data).
- Quality control of GPS data.
- Display cruise plan using way point list.
- Map/chart display.
- Live viewing of cruise track display during data collection.
- Synchronize echograms to cruise track with single click.
- Display of analysis results (e.g. echo integration) along cruise track.
- Option to import external or quality-controlled GPS data.
- ESRI shape files on the cruise track window.
- Create (along track) regions in the cruise track window.
Transects
- Create and edit transect groups.
- Assign a transect group the platform.
- Define and view transects.
- Import and export *.transect.csv files.
- Use of transect-based on screen and export analyses.
Scenes
- Create surfaces and curtains and 3D single target objects. Resample surfaces.
- Import surfaces.
- Export scenes in VRML format.
- 4D window.
Lines
- Create and edit editable and virtual lines.
- Use and edit line picks.
- Use line operators that can manipulate or create boundary lines - combine, span gaps, smooth, crop, time offset, towed body time offset or threshold offset.
- Manual setting of quality flags (good, bad or unverified) for lines.
- Manual setting of "user defined status" flags (e.g. for bottom-type definition).
- Set 'exclude data above' and 'exclude data below' lines to selectively omit data from analyses and exports, e.g. to exclude surface noise and bottom data.
- Export line data which has quality controlled depth, position and status information for pings in text data format for input into GIS, mapping or other data analysis packages.
- Import lines from other programs for display on echograms.
Surfaces
- Detect surfaces.
- Create a surface from a line.
- Create virtual surfaces.
- Export surfaces.
- Import surfaces.
- Create 3D digital terrain models of seabeds from lines.
- Import and display 3D seabed surfaces in a variety of formats.
- Set Exclude above and Exclude below surfaces to omit data from analyses, 3D School Detection and surface detection.
Regions
- Define and edit regions on echograms. Region types available - analysis, marker, fish track and bad data (two types).
- Echo integration of regions. This includes regions defined with the School Detection module and optional variables for region descriptors.
- User classification of analysis export regions by species or other classes.
Analysis of Sv and single target data
- Calibration of calibration corrections for TS and Sv variables using the Calibration Assistant and Calibration Report.
- Echo integration within layers referenced to the surface or the bottom.
- Echo integration in layers referenced to any user defined line (e.g. a line defining the second-bottom reflection for use in acoustic bottom typing applications).
- Maximum and minimum Sv thresholds for echo integration.
- Time varied threshold following TVG curve.
- Integration of background noise levels.
- TS distribution plotted on screen or exported for selections and regions.
- TS vs. depth plot on screen for selections and regions.
- Wideband Frequency Response graph for selections or regions filtered by a single target detection - wideband variable.
Graphs
- Threshold Response graph
- Frequency Response graph
- Relative mean dB graph
- Wideband Frequency Response graph
Operators
- Operators licensed with Essentials.
- Single target detection operators:
- Work with high resolution data from single frequency or modulated frequency data.
- Echogram display of single target detections (single echoes).
- Visualization of single targets overlaid on Sv or TS echogram.
- Single target filtering by position in beam and minimum and maximum thresholds.
- 3D beam graphs showing single targets in X,Y,Z space.
- Conversion of single targets into 3D objects for animated 3D visualization.
- Single target filtering by position in beam and minimum and maximum thresholds.
- Detect single targets in post processing - no a priori decisions during data logging about settings.
- Experiment with the effect of different detection parameters without having to replay data through an echosounder.
Export
- Export data from operators licensed with Essentials.
- Note: In a virtual variable chain, the final variable in the chain is subject to the licensing conditions of any previous operators in the chain.
- Export data from raw variables.
- Export of analyses (including analyses from other licensed modules).
- Optional export variables are available for region descriptors discussed by Urmy et al (2012) and school altitude descriptors.
- ICES CSV export.
- ICES netCDF4 Format export.
- Dataflow window, right-click menu export of Variable Properties settings to file.
- Multi-selection Ctrl+C and Select All for onscreen integration results.