Target properties from multibeam data
In Echoview, most target properties are calculated when creating a virtual variable with the Multibeam target detection operator.
Once targets have been detected, target properties can be examined by:
- Displaying the Details dialog box for the multibeam target detection echogram
- Exporting data from a single targets variable created via the Target conversion operator
- Displaying target property values in an echogram by creating a virtual variable using the TS substitution operator.
Working with multibeam target properties
There are many combinations of operators that can be used to work with target properties in multibeam data. The order that you apply operators and the combination of operators you use will be determined by your data and analysis needs.
In the Dataflow window ![]()
- Use the Multibeam target detection operator to detect targets in your multibeam data, with:
- a multibeam Sv variable as the input operand
- appropriate Multibeam target detection settings and Target linking settings
- appropriate Target property settings and Target strength source settings
- Use the Target conversion operator to create a single targets variable, with:
- your Multibeam target detection variable as the input operand
- Use the Target length conversion operator to display Target_length in a target length echogram, with:
- your Target conversion variable as the input operand
- Use the TS substitution operator to substitute alternative target property values for TS, with either:
- your Target conversion variable; or
- your Target length conversion variable as the input operand
- Use the Target property threshold operator to threshold targets, with either:
- your Multibeam target detection variable; or
- your Target conversion variable as the input operand
Notes:
- Steps 2-5 can be performed in a different order. For example, step 5 can be performed before step 2 or after step 2, depending on whether you wish to threshold multibeam targets or single targets.
- You can view specific targets in the multibeam data using looped multibeam replay.
- Prior to multibeam target detection, you will need to pre-process your multibeam Sv variable with steps such as data calibration, data thresholding and display settings. Depending on your data you may also wish to use some of the multibeam operators for steps such as background noise removal and other data manipulation.
- Once a suitable single targets variable has been created from multibeam target data, fish track detection may be possible. If fish tracks are detected, fish track region information together with available target properties can be exported through an Analysis by cells, Fish track database export.
- The Multibeam target overlay operator allows you to display specified multibeam data under detected multibeam targets.
- The Maximum intensity operator allows you identify targets that the multibeam target detection has missed and may provide information about tail-beat.
- The Echoview tutorial Introduction to Multibeam Target Data Processing contains examples of pre-processing steps, settings and operators for a virtual variable chain. Contact support@echoview.com to obtain this tutorial.
Performance tip: If you are working with single target echograms derived or created from the Target conversion operator, a technique to greatly improve Echoview's performance is to:
- Export your single target data.
- Add the exported single target data file to a new fileset in the original EV file.
- Display and use the echogram for the exported single target data.
Notes:
- The intent of this process is to avoid the recalculation process whenever the target conversion variable is displayed yet allow you to work with all the single target information and multibeam target properties.
- The Dataflow object for an added target.csv file will use the manual target lengths and target classes from the EV file instead of the manual target length and target classes in the .csv file when manual target length and target class positions in the .csv file match targets in the EV file.
- See also: Synchronize To Target.
Multibeam target properties
The following target properties are available. Some target properties are primary calculations. Others are calculated when the target property is selected on the Target page of the Variable Properties dialog box of the multibeam target detection virtual variable.
- Target length
- Target length across beams
- Target range extent
- Target perimeter
- Target perimeter edge midpoints
- Target area
- Target area edge midpoints
- Target intensity variation
- Target compactness
- Target compactness edge midpoints
- Target thickness
- Target orientation
It is possible to manually add and store two additional target properties:
The following properties are primary calculations:
Calculation notes
Multibeam target
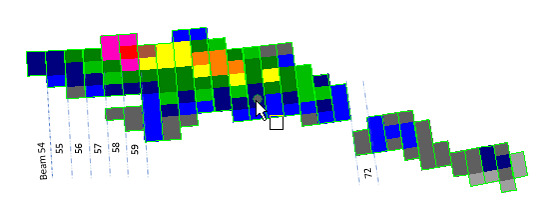
Figure 1: A mouse pointer over a multibeam target (circle), target interval outlines (green highlighted lines), target samples, and annotations for beam number.
Selecting a target with the mouse pointer, also displays associated Target Properties values on the Details dialog box. Figure 1 uses a configured color scheme and display settings to show the samples and target intervals that contribute to the target. Beam 58 and 59 display non-contiguous samples in the respective target intervals. The beam 72 annotation shows the start of a linked satellite and the satellite intervals of the selected target.
Display settings
- Display target interval outlines by selecting Show target outlines on the Echogram Display page of the Variable Properties dialog box
- Display target interval sample outlines by selecting Show target sample outlines on the Echogram Display page of the Variable Properties dialog box
Calculation intervals
A target interval is made up of the target samples in a beam. Such target intervals are used to simplify multibeam target property calculations. An interval can include non-contiguous samples (Figure 1 beams 58 and 59) and/or samples from a linked satellite of the target (Figure 1 beam 72 onward).
- Perimeter calculations
- Use the outside perimeters of samples that contribute to the intervals. Adjacent intervals' shared perimeters don't contribute to perimeter calculations.
- See also Outside sample mid-point perimeter geometry.
- Area calculations
- Use the area of samples that contribute to the target intervals.
- Compactness calculations
- Use the perimeter and area of the target.
- Thickness calculations
- Use the distance between the top of the first sample and the bottom of the last sample in an interval. When non-contiguous samples contribute to an interval, the gap between non-contiguous samples and/or the link distance between samples or satellites is included in the interval's distance calculation.
Angle minor axis
The minor-axis angular position at the geometric center of the multibeam target,
Angle major axis
The major-axis angular position at the geometric center of the multibeam target.
Target thickness (cm)
Target thickness is the maximum interval (range) distance of the multibeam target intervals.
Target class
A Target class can be applied to multibeam targets using the Target classification tool
![]()
Use the Classes page of the EV File Properties dialog box to specify new target classes. Target Classes are stored, displayed and managed in the Target Metadata window. Target classes are also displayed in the Details dialog box. The variable Target_class is exported in single target data exports and target length exports.
Target length (cm)
Target_length in multibeam data is estimated using the maximum distance between any two above threshold samples in the target, measured by angle and range from the transducer. The estimate is subject to qualifications that are inherent with the use of the Target conversion operator. In short, the identified targets do not a have a strict TS value, rather the "TS" value is calculated by the method specified under Target strength source on the Target page of the Variable Properties dialog box.
Target length data is calculated for the targets detected in a multibeam target detection virtual variable
Once target length data has been created, target lengths can be examined by:
- Exporting data from a target length variable
- Exporting data from a single targets variable that contains calculated target lengths
- Viewing a Length vs. Depth graph or a Length Frequency distribution graph.
The analysis export variable Target length mean is calculated and output for onscreen and exported single target and fish track analyses on single targets echograms.
You can also threshold single targets with respect to Target length using the Target property threshold operator.
Notes:
- The Target length conversion operator will output a no data value for each target that has no calculated Target length or for each target that has a negative Target length.
- The target length calculation in Echoview results in zero (0.00 cm) lengths when there is only one sample in the detected target because length is measured between the midpoints of samples. (Definition of multibeam target length). Despite a zero length, these targets will have positive perimeters and areas because they are measured around the sample edges.
- Target length calculations use sample midpoints. The calculation ignores sample thickness and beam width.
Target length manual (cm)
Target length can be manually measured on multibeam target echograms using the Tape measure tool  .
.
You can store manual measurements for targets and view and manage the data on the Target MetaData window. Manual target lengths, once stored, are displayed on the Details dialog box. The export variable Target_length_manual is exported in single target data exports. Details about the display of stored target lengths can be found in the discussion on the multibeam targets echogram.
For more information refer to Storing manual target lengths and the Performance tip note.
View target length and target length manual together
It is useful to analyze the target length and target length manual values together on screen. The screenshot below depicts a TS substitution variable. Brown targets have manual and estimated target lengths, grey targets have estimated target lengths only. The highlighted values in the Details dialog box are the manual target length (orange TS value) and the estimated target length (yellow Uncompensated TS value) for the target under the mouse pointer.
Figure 2: Details dialog box with Length and Length (manual) values of the selected target.
To view target lengths and target length manual measurements on the same virtual single target echogram:
- Set up step 4 of Working with multibeam target properties.
- Use a suitable single target variable as the input operand.
- In the TS value section on the TS substitution page of the Variable Properties dialog box enter the following settings:
- Populate TS with values from: Target length manual
- Set no data values to: Zero (-999 dB)
- In the Uncompensated TS section on the TS substitution page of the Variable Properties dialog box enter the following settings:
- Populate Uncompensated TS values from: Target length.
- On the Echogram Display page of the Variable Properties dialog box enter the following settings:
- Color display minimum: -999
- On the Data page of the Variable Properties dialog box enter the following settings:
- Select Apply minimum threshold.
- Select Lock to color display minimum.
- Click OK.
- View the TS substitution echogram.
Target length across beams (cm)
This property is faster to calculate than the Target_length property, and it can be more accurate for situations where fish are swimming perpendicular to the central beam.
Target length across beams is determined by:
- Finding for each beam in the target, the range of the midpoint between the shallowest sample and deepest sample.
- Finding the length of the line that traverses the target when the midpoints are joined.
Note: The Target_length_across_beams property is often faster to calculate than the Target_length property.
Target range extent (cm)
Target range extent is calculated as the range difference between the shallowest sample and the deepest sample in the target. This property could be used to analyze the target's swim-shape. When Target_range_extent is of the order of the Target_thickness, the target is fully extended and straight. While the target swims the Target_range_extent will vary between the Target_thickness and the value that reflects the maximum swim-shape. "Tail-beat" could be correlated to a selected (and repeated) value of Target_range_extent.
 |
Figure 3: Multibeam target and target range extent.
The screen shot (above) displays the:
|
Target range extent |
Target range extent is created using the TS substitution operator.
The virtual variable has a DIDSON color scheme, with lighter colors representing larger values of the Target_range_extent. In this case, the variation of light and dark segments the shape representing the progress of the moving fish. The segmentation together with the relationship between the Target_range_ extent and Target_thickness could yield information about swim shape and tail-beat. The display size of the single targets represent Target_range_extent as well. Looped multibeam replay with the Target overlay echogram is running. |
|
Maximum intensity |
Maximum intensity is created by the Maximum intensity operator and displays a maximum intensity echogram. The echogram provides a synopsis of the data and is also useful for examining tail beat characteristics. Tail beat characteristics and derived tail beat frequency, can be useful for species identification and bioenergetics studies. Experimental work by Anna-Maria Mueller1, using the Sound Metrics Corporation viewer, suggest that such sample intensity variation can be correlated with tail-beat frequency and could be used for species identification. |
|
Target overlay |
Target overlay is created using the Target overlay operator. Samples in detected targets are shown on top of the original multibeam data. Target linking has been selected with the multibeam target detection. |
|
Details |
The Details dialog box shows target information for the mouse pointer on the Target range extent echogram. Note the Target range extent and Target thickness are the same. Visually this corresponds to a straight fish. |
| Color legend |
The Color legend shows the DIDSON color scheme for the Target range extent echogram. |
Target perimeter (cm)
Target perimeter is calculated as the sum of the target perimeter contributions from the above-threshold samples in the target. The measurement uses the full sample space. For targets that have only one sample, the target length will be 0.0 cm but the target perimeter will be the sum of the sides of the sample.
Target perimeter edge midpoints (cm)
The Target perimeter edge midpoints calculation uses the distance between outside sample-edge midpoints of the target. The use of outside sample-edge midpoints results in a smaller target perimeter value. This perimeter calculation is the sum of the target circumference contributions from the above-threshold samples in the target. For targets that have only one sample, the target length will be 0.0 cm but the target perimeter will be the sum of the distances between the sample-edge midpoints.
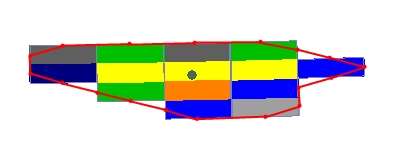
Figure 4: Perimeter edge midpoints of a target.
The diagram above shows a detected multibeam target (circle) and input data under the target; the target samples span five beams of the multibeam ping. A red perimeter is drawn between outside sample-edge midpoints.
Outside sample-midpoint geometry
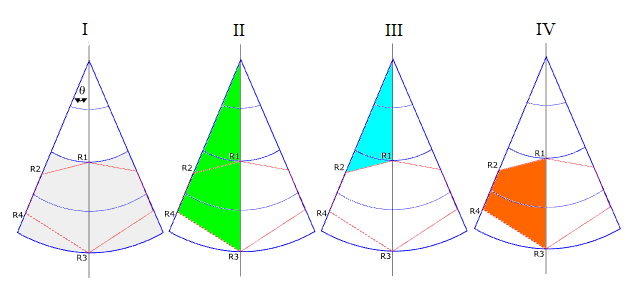
Figure 5: Edge mid-point perimeter samples and geometry.
Edge mid-point perimeter
Echoview makes use of sample ranges (in meters, from the operand), half of the beam width angle (radians) and the law of Cosines to calculate distances between target sample-edge midpoints. Diagram I shows two samples (in grey fill) within one beam of a multibeam ping. The angle theta is half of the beam width. The red lines show the perimeter traced between outside sample-edge midpoints.
The equation for the distance R1R2 in meters using the law of Cosines is:
The law of Cosines equation is used for cases like R3R4, as well as for purely horizontal distances. Purely vertical distances are based on the difference in range of the midpoints.
![]()
Target area (cm2)
Target area is defined as the sum of the areas of all samples within the boundary of the target.
Where:

Notes:
- The midpoint of the sample is used to determine inclusion/exclusion of a sample in the target in the same way that inclusion is determined for analysis domains.
- See also: About start and stop ranges, Calculation intervals.
Target area edge midpoints (cm2)
Target area edge midpoints is the area within the boundary defined by Target perimeter edge midpoints. The use of sample-edge midpoints results in a smaller target perimeter value and as a result a smaller target area value.
Echoview makes use of sample ranges (in meters, from the operand), half of the beam width angle (radians) and geometry to calculate the area enclosed. Enclosed rectangular areas are calculated in the normal way.
Enclosed non-rectangular areas are calculated by the method shown in diagrams II, III and IV. The non-rectangular area (m2) equation is:
![]()
Target intensity variation
Target intensity variation is calculated as:
Where:
CV = Coefficient of Variation of the intensity of the samples in the target. σ = standard deviation of the intensity of the samples in the target.
μ = mean intensity of samples in the target. xi = intensity value of sample i in the target. N = number of samples in the target.
Target compactness
A common compactness measure of a shape is the circularity ratio, based on the notion that a circle has the most compact shape. This is the ratio of area of the shape to the area of a circle having the same perimeter.
However, in pattern recognition literature, the inverse of the Circularity ratio is often discussed2. Hence, Echoview's target compactness is calculated as:
See also: Calculation interval details for Target perimeter and Target area, Target perimeter and Target area.
Target compactness edge midpoints
The Target compactness edge midpoints value is calculated using the Target perimeter edge midpoints and the Target area edge midpoints values. The use of sample-edge midpoints results in a smaller target perimeter and smaller target area.
Target orientation
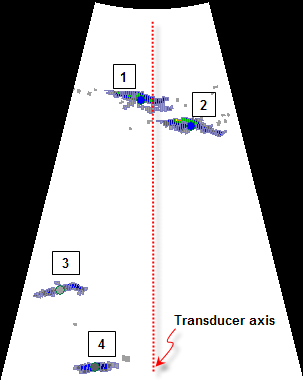
The Target_orientation property is the angle between the Target_length derived axis and the line perpendicular to the transducer axis. The Target_length axis is defined as the line joining the two most distant samples in the target. The available range of values is 0° ≤ Target_orientation < 180°.
|
Figure 6: Annotated multibeam target detection echogram. |
The annotated screen shot (left) shows a Multibeam target detection sector plot with four (fish) targets. A selection of tabulated target properties is given for the four targets.
Notes:
|

See also
About multibeam targets
About_target_properties
Target_length_from_single_beam_data
Measuring_the_distance_between_two_points
Multibeam_target_detection_algorithm
About_fish_tracks
About_detecting_fish_tracks
1. Anna-Maria Mueller, Aquacoustics, pers. comm.
2. Mulligan T, 2008, Scientist Emeritus, Pacific Biological Station, Department of Fisheries and Oceans, Canada, pers. comm.