Viewing 3D object properties
3D object properties are viewed on the pages of the 3D Object Properties dialog box. The Further Information box on the General page of the 3D Object Properties dialog box displays further properties specific to the type of 3D object. These are described here.
Properties are described in the following sections:
- Common 3D object properties
- Surface properties
- 3D region properties
- 3D region track properties
- 3D polyline properties
- 3D single targets properties
- 3D fish track properties
- Multibeam ping curtain properties
- Echogram curtain properties
- Raster image properties
- 3D Model object properties
Common 3D object properties
The following properties are displayed for all 3D objects.
|
Property |
Unit |
Description |
|
Vertices |
- |
Number of vertices in the 3D object |
|
Triangles |
- |
Number of triangles in the 3D object (a measure of surface complexity) |
|
Reference point |
degrees or meters |
Geographic position of the reference point at which the 3D object has been placed |
|
N-S length |
m |
Maximum length of the 3D object in the north/south axis |
|
E-W length |
m |
Maximum length of the 3D object in the east/west axis |
|
Minimum depth (below mean sea level) |
m |
Minimum depth (below mean sea level) of the 3D object. Note that Echoview does not use the platform's water surface level. |
|
Maximum depth (below mean sea level) |
m |
Maximum depth (below mean sea level) of the 3D object. Note that Echoview does not use the platform's water surface level. |
|
Height |
m |
Maximum height of the 3D object |
|
Created |
dd/MM/yyyy HH:mm:ss.sss |
Date and time that the 3D object group was created in Echoview |
|
Acquired |
dd/MM/yyyy HH:mm:ss.sss |
Date and range of times that the data was collected, i.e. the time span over which the data on which the object is based was acquired. For example, "Acquired: 14/05/1999 23:09:58.000 to 23:10:19.500" means that the data from which the school was detected was collected on 14 May 1999 from all pings at or between 9 minutes 58 seconds past 11 p.m. and 10 minutes 19.5 seconds past 11 p.m. Acquired defaults to unknown. This metric is only available for objects which were created from echogram data. This does not include raster images or 3D models. |
|
Valid |
dd/MM/yyyy HH:mm:ss.sss |
Date and time range for which the data can be considered useful. This metric is only available for objects which were created from echogram data. This does not include raster images or 3D models. |
Surface properties
The common 3D object properties and the following additional properties are displayed for 3D surfaces.
|
Property |
Unit |
Description |
|
Surface area |
m2 |
Surface area of the surface |
3D region properties
The common 3D object properties and the following additional properties are displayed for 3D region objects.
Note: You will not be able to view all of these properties unless you have purchased the Multibeam School Detection license.
|
Property |
Unit |
Description |
|
School detection algorithm |
- |
The 3D school detection algorithm used to detect schools in the 3D region. Refer to 3D school detection algorithms for more information. |
|
Surface area |
m2 |
Surface area of the 3D region |
|
Volume |
m3 |
Volume of the 3D region. This does not include the volume of any vacuoles in the 3D region. To include the volume of vacuoles add Total vacuoles volume (below). Note: Volume calculations in analyses prior to the Echoview 5.4 release may be affected by the introduction of Bad data (empty water) regions. Volume may increase when a bad data (no data) region completely covers a bad data (empty water) region. |
|
Geometric center |
degrees or meters, |
Geographic position and depth (below mean sea level) of the point at the geometric center of the 3D region. If using the UTM projection, geographic position is measured in eastings and northings. Other projections use longitude and latitude. |
|
First beam area |
m2 |
Surface area at the intersection of the 3D region and the first beam in the variable used to create it (by school detection). Note: this does not refer to pings in the variable chosen for analysis, but pings in the variable used for school detection. |
|
Last beam area |
m2 |
Surface area at the intersection of the 3D region and the last beam in the variable used to create it (by school detection). Note: this does not refer to pings in the variable chosen for analysis, but pings in the variable used for school detection. |
|
Max range area |
m2 |
Surface area at the intersection of the 3D region and the maximum recorded range in the variable used to create it (by school detection). Note: this does not refer to pings in the variable chosen for analysis, but pings in the variable used for school detection. |
|
First ping area |
m2 |
Surface area at the intersection of the 3D region and the first ping in the variable used to create it (by school detection). Note: this does not refer to pings in the variable chosen for analysis, but pings in the variable used for school detection. |
|
Last ping area |
m2 |
Surface area at the intersection of the 3D region and the last ping in the variable used to create it (by school detection). Note: this does not refer to pings in the variable chosen for analysis, but pings in the variable used for school detection. |
|
Total intersection surface area |
m2 |
Sum of the First beam area, Last beam area, Max range area, and Last ping area |
|
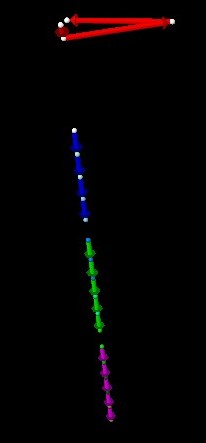
m, m, m |
Longest, next longest and shortest dimensions of the 3D object-aligned bounding box.
The depicted 3D object is a 3D region that was created by a 3D school detection on multibeam data. A 3D regions' bounding box is a 3D region metric and the box can be displayed in a scene. |
|
|
OBB orientation |
degrees, degrees, degrees |
The elevation, azimuth and rotation of the object bounding box's axes, defined as follows: Elevation: the angle between the longest axis of the object-aligned bounding box and the horizontal. Ranges from -90 (vertical downwards) through 0 (horizontal) to 90 (vertical upwards). Azimuth: the angle between the longest axis of the object-aligned bounding box and north. Ranges from 0 (north) through 90 (east) and 180 (south) to 360 (north) Rotation: the angle of rotation of the second longest axis of the object-aligned bounding box about the longest axis when viewed in the upward sense of the longest axis. Ranges from 0 (horizontal) to 90 (most upward direction) to 180 (horizontal). |
|
Roughness |
/m |
Surface area of the 3D region divided by volume of the 3D region |
|
Vacuoles |
- |
Number of vacuoles contained within the 3D region. |
|
m3 |
Volume of all the vacuoles in the 3D region. Property only displayed when vacuoles are present. |

3D region track properties
A subset of common 3D object properties and the following additional properties for each 3D point in the region track are displayed.
|
Property |
Unit |
Description |
|
Location |
Latitude (degree) Longitude (degree) at depth (meters below mean sea level) |
Latitude, longitude and the depth (below mean sea level) of the point. |
|
Time |
dd/MM/yyyy HH:mm:ss.sss |
Average valid time for the point. |
|
Intensity |
dB |
Intensity records the mean Sv of the 3D region this point represents. If the mean Sv could not be calculated at the time of detection this value will be -9.9e+37. See Integration from scenes for further information. It can be used to determine the display color for the point. To do so, you must select the Intensity display method on the Display page of the 3D Object Properties dialog box for the 3D region track group (i.e. all the 3D points in all the 3D region tracks in a 3D region track group share the same intensity display definition). |
|
Velocity |
m/s, m/s, m/s |
Velocity of the 3D region moving from the previous point to the current point, expressed as three speed components of the velocity vector in three orthogonal directions as follows [Latitudinal component, Longitudinal component, Depth component]. This is not available for the first point in a track (as there is no previous point from which to measure velocity by this definition). |
3D region track group properties
A subset of the common 3D object properties are displayed for 3D region track groups.
3D polyline properties
A subset of common 3D object properties and the following additional properties for each 3D point in the 3D polyline are displayed.
|
Property |
Unit |
Description |
|
Location |
Latitude (degree) Longitude (degree) at depth (meters below mean sea level) |
Latitude, longitude and the depth (below mean sea level) of the point. |
|
Time |
dd/MM/yyyy HH:mm:ss.sss |
Average valid time for the point. |
|
Intensity |
- |
Intensity can record any value useful to you and is specified in the .epl file from which the polylines were imported. It can be used to determine the display color for the point. To do so, you must select the Intensity display method on the Display page of the 3D Object Properties dialog box for the 3D polyline group (i.e. all the 3D points in all the 3D polylines in a 3D polyline group share the same intensity display definition). |
|
Velocity |
m/s, m/s, m/s |
Velocity of the 3D region moving from the previous point to the current point, expressed as three speed components of the velocity vector in three orthogonal directions as follows [Latitudinal component, Longitudinal component, Depth component]. This is not available for the first point in a track (as there is no previous point from which to measure velocity by this definition). |
3D polyline group properties
A subset of the common 3D object properties are displayed for 3D polyline groups.
3D single targets properties
A subset of the common 3D object properties and the following additional properties are displayed for each 3D point in the 3D single targets object (each 3D point represents a single target).
|
Property |
Unit |
Description |
|
Location |
Latitude (degree) Longitude (degree) at depth (meters below mean sea level) |
Latitude, longitude and the depth (below mean sea level) of the point. |
|
Time |
dd/MM/yyyy HH:mm:ss.sss |
Valid time for the point. This is the time of the ping for the single target. |
|
Intensity |
dB |
Intensity records the TS of the single target this point represents. It is used to determine the display color for the point. |
Single target group properties
A subset of the common 3D object properties are displayed for 3D single target groups.
3D fish track properties
A subset of the common 3D object properties and the following additional properties are displayed for each 3D point in the 3D fish track (each 3D point represents a single target).
|
Property |
Unit |
Description |
|
Location |
Latitude (degree) Longitude (degree) at depth (meters below mean sea level) |
Latitude, longitude and the depth (below mean sea level) of the point, that represents a single target in the valid fish track region used during creation of the 3D fish track. |
|
Time |
dd/MM/yyyy HH:mm:ss.sss |
Valid time for the point. This is the time of the ping for the single target in the valid fish track region used during creation of the 3D fish track. |
|
Intensity |
dB |
Intensity records the TS of the single target this point represents. It is used to determine the display color for the point. |
|
Velocity |
m/s, m/s, m/s |
Velocity of the single target moving from the previous point to the current point, expressed as three speed components of the velocity vector in three orthogonal directions as follows [Latitudinal component, Longitudinal component, Depth component]. This is not available for the first point in a track (as there is no previous point from which to measure velocity by this definition). |
Fish track group properties
A subset of the common 3D object properties are displayed for 3D fish track groups.
Multibeam ping curtain properties
The common 3D object properties and the following additional properties are displayed for multibeam ping curtains.
|
Property |
Unit |
Description |
|
Bitmap color bits |
- |
Number of bits used to represent color in the image |
|
Stored bitmap width |
pixels |
Width of the image |
|
Store bitmap height |
pixels |
Height of the image |
|
Beams |
- |
Number of beams in the multibeam ping this curtain represents |
|
Data points |
- |
Number of data points in the multibeam ping this curtain represents |
Multibeam ping curtain group properties
A subset of the common 3D object properties are displayed for multibeam ping curtain groups.
Echogram curtain properties
A subset of the common 3D object properties and the following additional properties are displayed for echogram curtains.
|
Property |
Unit |
Description |
|
Live updating from variable |
- |
Is displayed only if the Live update option was set when the echogram curtain was created. Indicates that this echogram curtain will respond if pings are added to or removed from the specified variable. |
Echogram curtain segment properties
A subset of common 3D object properties and the following additional properties are displayed for echogram curtain segments.
|
Property |
Unit |
Description |
|
Bitmap color bits |
- |
Number of bits used to represent color in the image |
|
Stored bitmap width |
pixels |
Width of the image |
|
Store bitmap height |
pixels |
Height of the image |
Raster Image properties
The common 3D object properties and the following additional properties are displayed for image 3D objects.
|
Property |
Unit |
Description |
|
Bitmap color bits |
- |
Number of bits used to represent color in the image |
|
Stored bitmap width |
pixels |
Width of the image |
|
Store bitmap height |
pixels |
Height of the image |
|
North-west corner |
degrees or meters |
For each section, you can view:
Notes:
|
|
North-east corner |
||
|
South-west corner |
||
|
South-east corner |
3D Model object properties
The common 3D object properties and the following additional properties are displayed for 3D model objects.
|
Property |
Unit |
Description |
|
Model loaded from file |
- |
File name and path of the 3D model object that was imported into the EV file Note: This file exists independently of the 3D object in Echoview |
|
Normals |
- |
Number of normals in the 3D object file |
|
Facet normals |
- |
Number of facet normals in the 3D object file |
|
Materials |
- |
Number of materials in the 3D object file |
|
Groups |
- |
Number of groups in the 3D object file |
|
Material library |
- |
Material (.mtl) file related to the 3D object file |
See also
3D Object Properties dialog box
Exporting 3D objects
About region tracks
About 3D polylines