Understanding echograms
The echogram window is split into these areas: the echogram title area, the echogram itself, and for single beam echograms the integram area, the position status area, the GPS fix area and the transect area. The integram, position status and transect areas can be hidden.
Echogram window title bar
The title bar is at the top of the echogram window and displays the title of the echogram. The title consists of the echogram's fileset (only for raw variables), the variable name and EV file name.
The transducer frequency will also be displayed in the title, corresponding to the frequency on the Calibration page of the Variable properties dialog box. The transducer frequency will be displayed for virtual variables that satisfy the same criteria.
Echogram area
When first opened, the horizontal axis of the echogram displays one ping per screen pixel, and the vertical axis displays the average of data points, falling within the depth range represented by one screen pixel.
There are many types of echograms, displaying different types of data. What any data point represents depends upon the type of variable being displayed (note, some special data values may be used for the display).
Data values are color-coded according to the current Color display minimum and Maximum threshold settings. You can see what colors currently apply by viewing the Color legend dialog box.
The upper and lower display limits of an echogram are determined by the data range of the first ping of the first data file added to the EV file. This can be overridden on an echogram by echogram basis by changing the upper and lower display depth settings on the Echogram Display page of the Variable Properties dialog box.
Lines, regions and a grid, can be superimposed on the echogram, if they have been defined.
Integram, transect, GPS fix and position status areas
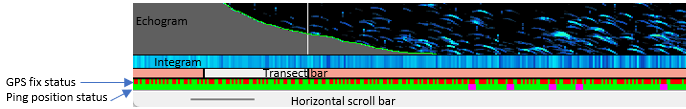
Figure 1: Echogram, Integram, transect bar, GPS fis status and Ping position status areas. The Integram area displays the ping Mean Sv as light blue to dark blue. The Transect bar area displays transect pings in red bars and off-transect pings in white bars. The GPS fix status area displays GPS fix status in green and red. The Ping Position status area displays Position status in green and magenta.
Integram
The integram can display any of:
- Ping status
- Mean Sv
- Maximum Sv
- Bottom classification
as selected on the Echogram Display page of the Variable Properties dialog box.
It can also be used to automatically skip to pings that satisfy an Integram Sv threshold condition.
Notes:
- The integram area can be used for any classification purpose.
- The integram area is only visible if configured on the Echogram Display page of the Variable Properties dialog box.
See also: the Glossary: Integram, About the integram and Using the integram.
Transect bar
Refer to Using transects: Visualizing transects.
GPS fix status
Each ping that has an associated GPS fix is indicated by a colored tick showing the status of the fix. The fix associated with a ping is the last fix in time prior to the time of the ping. Only one GPS fix is displayed per ping. The ticks are colored as follows:
GPS fix status |
||
Green |
indicates the GPS fix status |
'good' |
Red |
indicates the GPS fix status |
'bad' |
Position status area
To display or hide the position status area use the Show position status box under Show on echogram on the Echogram page of the EV File Properties dialog box.
This area displays the Position status of each ping according to the following legend:
Ping position status |
||
Green |
indicates the position status |
'good' |
Magenta |
indicates the position status |
'uncertain' |
| Gray | indicates the position status | 'unknown' |
See Determining GPS fix status and Determining Ping position status for a detailed information about how GPS fix status and ping position status are defined.
See also
About regions
About lines
About integration
Exporting in Echoview
Echogram navigation: Auto-synchronization
Echoview Information toolbar
Echoview Status bar
Echogram interpretation
Virtual variable applications