About the Dataflow window
- Using the Dataflow window
- Views
- Colors and shapes in the Dataflow window
- See also
The Dataflow window is used to manage all variables, geometry related objects, scenes and created/detected/imported 3D objects, and can be used with the Dataflow Toolbox. The window displays relationships between transducers and the platform, their inputs and outputs, as well as the data flow relationships between raw acoustic and virtual variables and objects. Multiple custom views can be designed to display your choice of objects and their relationships. General, Analysis, Grid and Note details are displayed in the Details dialog box for objects under the mouse pointer.
To display the Dataflow window, do one of the following:
- On the Windows and dialog boxes toolbar, click
 , or
, or - On the View menu, click Dataflow, or
- Press the F7 key.
You can also print the displayed contents of the Dataflow window.
Using the Dataflow window
You can arrange variables and objects on the window by selecting, dragging and dropping them as required.
Context sensitive drag and drop arrows can change:
- operands
- transducers
- Platform Position source when the Platform type is Position determined by GPS.
- Platform Water current speed source when the Platform type is Fixed
- Platform Heave source
Notes:
- Raw and virtual position variables can be set as a Position source on the Platform. Allowable virtual position variables are those that avoid creating a circular dependency.
- Allowable virtual lines for the Platform Heave source are those that avoid creating a circular dependency.
- Using Echoview: Key concepts and Data processing workflow.
- See also object naming rules.
Use the Rectangular selection tool to:
Select an object
- Click on the object, to select it.
Select multiple objects
- Use the mouse to draw a selection over desired objects.
-
-OR-
- Use Ctrl + click to select multiple objects.
-
-OR-
- Use the Objects List pane to select the desired objects within a dataflow view.
See also Variable Properties- Multiple Variables Selected dialog box.
Unavailable objects
Use Shortcut menu (right click), Show, select Unavailable Objects to display this type of object in a Dataflow View.
- EV files with Fileset-selected unavailable raw variables display associated dataflow objects and virtual variables as grey icons with Variable Properties. Unavailable raw variables are not displayed. See also, the Unavailable Objects section of the Objects List.
- Template EV files display unavailable raw variables, objects and virtual variables as grey icons with Variable Properties.
Editing
Objects and variables highlight when you point to them. Variables and lines can display a node - this indicates it can be used as an input for an object or another variable.
When you drag an arrow from an object, all available objects appear solid and surrounded by a halo, unavailable objects appear semi-transparent.
To change input operands :
- drag (an arrow) from a node and drop the arrow onto an eligible (target) object or variable.
- - OR -
- select an input operand in the Variable Properties dialog box of the virtual variable or object.
Notes:
- The drag and drop method replaces the first operand in the target variable.
- When the Platform type is Fixed, you can drag from a Speed variable node to the Platform object to specify a Water current speed source.
Copy and Paste
You can copy dataflow objects to your clibboard and paste them into the same or another views, or another EV file.
Select one or more dataflow objects and use the shortcut menu (or keyboard shortcut) to
- Copy (Ctrl+C)—copy the object.
- Cut (Ctrl+X)—copy the object and delete the original.
Then navigate to the destination views or EV file and from the shortcut menu choose
- Paste (Ctrl+V)—to paste the copied object(s). This is like a pointer to the original object. Changes to the copy affect the original.
- Paste A Copy—to paste a clone of the copied object(s). This creates a new object.
Properties of pasted objects
The newly pasted dataflow object (or the first object if pasting a virtual chain) loses its input operands and loses its Calibration Source.
Line variables may be included in the Copy/Paste of a virtual variable chain. Lines may be discrete objects in the chain or be a selected line within the Variable Properties of another variable. For missing lines, affected settings are set to None. For unavailable lines (grey), such lines can be reconnected in the dataflow window or changed via the Variable Properties of an affected variable.
Virtual variables can lose the settings for Exclude above and Exclude below. Reset your Exclusion lines or surfaces on the Analysis Page of the Variable Properties dialog box.
Line variable may lose the setting for the Line Source. Reset the Line Source on the Source page of the Line Properties dialog box.
Copy/Paste between EV files defaults to the use of the first transducer in the destination file. Otherwise, you can copy a virtual with its transducer.
Copy/Paste of Surface, 3D object and Scene objects is available between views and between EV files.
Copying across Echoview versions
It is not recommended to copy and paste dataflow objects directly between different versions of Echoview.
Instead open the EV file with the dataflow objects (and saved with the older Echoview version) in the newer version of Echoview.
Alternatively, use the import feature to load the dataflow objects in the newer version of Echoview.
You can then copy and paste the variables (into another EV file or view).
Grouping
Multiple objects in a view can be grouped together, groups can be collapsed or expanded, and objects can be added to or removed from groups using the Grouping sub menu available from the Shortcut (right-click) menu.
Group
Creates a group from the selected objects; a color window will open for selecting a color to identify the group and group objects with. Group objects are shown inside a colored rectangle.
Notes:
- Once objects are grouped they will respond as one to Show and Hide options on the Shortcut menu.
- The color of the arrow(s) going into the group represents the color of the group only and has no data type.
- The color of the arrow leaving the group has the data type color of the output of the last object in the chain.
- Groups are unique to a View. A variable grouped in one View may not be grouped in another View.
|
Grouping Option |
Description |
|
Collapse |
Collapses the group objects and replaces them with a single group rectangle displayed in the group color, with the group name. Note: A red inner border indicates that one or more of the objects within the group uses LocalCal settings. |
|
Expand |
Expands the group to show all objects in the group. |
|
Ungroup |
Ungroups the objects in a selected group, or removes a selected object from within an expanded group. |
|
Group Properties |
Opens the Group Properties dialog box where you can change the name and color used for the group and record Notes. |
Menu items
You can perform certain tasks from the Dataflow window using the following commands on the Dataflow menu and/or Shortcut (right click) menu.
|
Menu item |
Description |
||||||||||||||||||||
|
A sub menu from which you can create a new dataflow object. The following may appear:
Notes:
|
|||||||||||||||||||||
|
Delete |
Delete the selected object(s) from the EV file. There is no undo for this option. Notes:
Tip: If you wish to remove the object from the current view only - use the Hide command. |
||||||||||||||||||||
|
Delete All Virtual Variables |
Delete all virtual variables (visible and unavailable) from the EV File. Note: This option is only available on the Dataflow menu. |
||||||||||||||||||||
|
Rename |
Renames the object. The Reset button on the Notes page of the Variable Properties dialog box can be used to reset to the default name. |
||||||||||||||||||||
|
Cut |
Cuts selected dataflow objects (to the Clipboard), ready for a Paste or Paste a Copy. The availability of Cut is dataflow object sensitive. Note: Transducers that are used by variables are not cut, but are copied. |
||||||||||||||||||||
|
Copy |
Copies the selected dataflow objects to the Clipboard. Refer to Copy and Paste for more information. |
||||||||||||||||||||
|
Paste |
This action is View sensitive. It can create a copy of the selected dataflow objects (from the Clipboard) or reveal the selected dataflow object (from the Clipboard). Refer to Copy and Paste for more information. |
||||||||||||||||||||
|
Paste a Copy |
Available in views other than the one where the objects were selected. Creates a copy of the selected dataflow objects (from the Clipboard) unless they are raw objects. Refer to Copy and Paste for more information. |
||||||||||||||||||||
|
Echogram |
Displays an echogram of the selected variable. This is the same as double-clicking the variable. Note: This option is only available on the Shortcut menu. |
||||||||||||||||||||
|
4D |
Displays a 4D window for the selected variable. For more information refer to 4D window. Note: This option is only available on the Shortcut menu. |
||||||||||||||||||||
|
Export is available from a dataflow object's Shortcut menu. Export options for acoustic variables and other objects are displayed. A limited range of Export options is available using the Dataflow window Shortcut menu.
|
|||||||||||||||||||||
|
Reclassify Bottom |
Reclassify Bottom is available from a bottom points variable's Shortcut menu. This feature reuses the settings and extracted features of the variable and reruns a Classify Bottom k-Means calculation. The k-Means calculations begin with a random initialization and finish with a clustered output. The result may be different for each k-Means recalculation. For more information refer to Bottom classification algorithm. Note: Reclassify bottom deletes any new or renamed classes. |
||||||||||||||||||||
|
Cruise track |
Displays a cruise track of the selected variable. For position variable this is the same as double-clicking the variable, for acoustic variables it will display an alongtrack display. Note: This option is only available on the Shortcut menu. |
||||||||||||||||||||
|
Graph |
Displays a graph of a selected applicable variable. This is the same as double-clicking the variable. Variables that are displayed as graphs are: Note: This option is only available on the Shortcut menu. |
||||||||||||||||||||
|
Clears the Generation statistic for the selected variable. Pings are generated in Echoview on demand; for example, when an echogram is displayed or data is exported. The Generations statistic appears in the Details dialog box for objects that display echograms. The statistic can be used to set the ping cache limits in order to optimize processing performance. Note: If the Generations value does not increase each time you open the variable, then all pings for that variable are being cached. On the Performance page of the Echoview Configuration dialog box a cache setting and cache information are available. |
|||||||||||||||||||||
|
Zoom In |
Zoom in a fixed amount. |
||||||||||||||||||||
|
Zoom Out |
Zoom out a fixed amount. |
||||||||||||||||||||
|
Unzoom |
Unzoom. |
||||||||||||||||||||
|
Select All |
Select all objects in the current view. |
||||||||||||||||||||
|
Select None |
No objects selected. |
||||||||||||||||||||
|
Select with Upstream Objects |
Select all the visible data dependant objects upstream of the specified object or objects. |
||||||||||||||||||||
|
Select |
Select an object type in the current view using the Select list. |
||||||||||||||||||||
|
Opens the Objects List panel within the Dataflow window. The panel displays objects in the current View. You can search for objects in the View by object name, Echoview module name, or operator group. Click on an object to select it in the Dataflow window. Use the mouse together with Shift or Ctrl to select multiple objects. Commonly used Dataflow window features, like Properties, are easily accessible to listed objects via a Shortcut menu. To clear filtering highlights or selections in the view, delete the search text or press ESC Note: Variables within a collapsed group are not shown in the Objects list. |
|||||||||||||||||||||
|
Show... |
Opens the Show In View dialog box to select additional objects to show in the current view. Other settings that can affect Show or Hide: Shortcut menu > View menu > View Properties has:
Note: When a View does not display desired variable(s), the quick way to show them is to Copy them from another view and in the required view use Shortcut menu > Paste. See Copy and Paste for more information. |
||||||||||||||||||||
|
Hide |
Hides the selected object(s) from the current view. Other settings that can affect Show or Hide: Shortcut menu > View menu > View Properties has:
|
||||||||||||||||||||
|
Views can be customized using the View sub menu. On the sub menu, View Properties has:
Other settings that can Show or Hide selected objects:
See Views below. |
|||||||||||||||||||||
|
Grouping |
This option is available on the Shortcut menu for grouping multiple objects together in the active view. See Grouping below. |
||||||||||||||||||||
|
Automatically arranges the icons in current view of the Dataflow window. Options include:
There is no undo for the Arrange Objects options. |
|||||||||||||||||||||
|
Lock Details |
Lock/Unlock the display of the Details dialog box. Shortcut menu > Lock Details (Ctrl+K) |
||||||||||||||||||||
|
Variable Properties |
Displays Variable Properties dialog box for a selected variable. |
||||||||||||||||||||
|
Line Properties |
Displays Line Properties dialog box for a selected line. |
||||||||||||||||||||
|
Transducer Properties |
Displays Transducer Properties dialog box for a selected transducer. |
||||||||||||||||||||
|
Platform Properties |
Displays Platform Properties dialog box for a selected platform. |
||||||||||||||||||||
|
Help |
Displays About the Dataflow window. |
Notes:
- Raw variables that are not checked in the Raw variables section of the Filesets window are unavailable and cannot be used for creating new virtual variables or lines. See also: Removing data files from a fileset note.
- The shapes and color of each arrow and icon is determined by the type of data or object, and the View Properties settings. See Colors and shapes in the Dataflow window below.
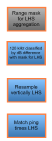
Sticky notes
A Sticky Note allows you to add annotations to the Dataflow window. Sticky Notes may be placed anywhere on the Dataflow window and the background color may be specified. An empty Sticky Note will display the note name. Sticky Notes are copied by templates.
To create a Sticky Note, on the Dataflow window use the Shortcut menu (right-click), New, Sticky Note.
Navigation
Pan
To pan across the Dataflow window:
- Click the Pan tool
 , click and drag.
- OR -
- Press the Spacebar, click and drag.
- OR -
- In Rectangular selection mode, click the mouse wheel and drag.
Note: While you are using the Pan tool but are not actively panning, you can right-click to select an object under the mouse pointer and gain access to the Shortcut menu.
Zoom
To zoom in the Dataflow window:
- Rotate the mouse wheel to zoom in and out.
- OR -
- Use the Zoom tools on the Zoom toolbar.
Tip: To make all objects fit (visibly) in the window, click the mouse wheel. To return to the previous zoom level click the mouse wheel again. The position of the mouse pointer for the second click will center the window about that position.
Views
Multiple custom views can be created in the Dataflow window to suit your display purposes. Defined views are made available by clicking the View tabs, located at the bottom of the Dataflow window.
To manage and create views, use the View sub menu available from the Shortcut (right-click) menu.
To rearrange the order of the View tabs, click on a View tab then click + drag that tab to a new position.
To add new objects to the view use Show on the Shortcut (right-click) menu.
Use the Objects List pane to locate objects within a dataflow view.
|
View Option |
Description |
|
New View |
Creates a new, blank view window; a new tab will appear at the bottom of the window. |
|
New View from Selected |
Creates a new view with the objects that are selected. |
|
Delete View |
Deletes the current view. |
|
View Properties |
Opens the View Properties dialog box where you can change the name, the scheme for object color and shape, the data relationship displayed between objects, and the type of new objects to add to this view automatically. Under View Properties:
|
Note: Pre-set views in EV files saved in Echoview 4.30 or earlier are reproduced as they were saved (with small differences), on the condition that you used the views. Views that were never used will not be replicated accurately.
Colors and shapes in the Dataflow window
Arrows
When Standard is chosen for the Relationship type setting on the View Properties dialog box, the annotated black and orange arrows indicate the relationship between objects.
When Line and surface usage is chosen for the Relationship type setting on the View Properties dialog box, relationships between variables, lines and surfaces are shown with annotated black arrows.
|
Annotation |
Relationship type |
|
n |
Indicates the operand n. Where n is an integer. |
|
T |
Transducer An arrow between a Transducer and virtual variable is shown when the Transducer is different from the first operand's transducer. The transducer for any particular variable is selected on the Calibration page of the Variable Properties dialog box. |
|
D |
Arrow comes from a distance variable. |
|
H |
Arrow comes from a heading variable. |
|
P |
Arrow comes from a position variable. |
|
V |
Arrow comes from a heave variable. |
|
U |
Line used as the Exclude above line. Surface used as the Exclude above surface. |
|
L |
Line used as the Exclude below line. Surface used as the Exclude below surface. |
|
G |
Line used as line for Show depth/range/line-referenced grid on the Grid page of the Variable Properties dialog box. |
|
S |
Arrow comes from the acoustic variable that is specified as the Line source for line recalculation. |
|
A |
Line is the Active line in the echogram. Surface is the Active surface in the echogram. Note: After changes to the active line, the Line and surface usage view may need to be refreshed manually by using the View Properties dialog box again. |
Objects
The following shapes are used to distinguish different objects within the Dataflow window:
|
Symbol |
Object type |
 |
A drag and drop arrow node appears on a dataflow object under the mouse pointer. Left click and drag the node's arrow onto a destination object. Suitable destination objects are displayed with a bright halo. Use drag and drop to specify: input variables for operators, a Platform's Position source, or an object's Transducer. |
 |
Platform |
 |
Transducer |
 |
Transect group object |
 |
Surface object |
 |
Virtual Surface object |
 |
Scene object |
 |
3D Single beam ping curtain object 3D Multibeam ping curtain object |
 |
3D Single targets group object |
 |
3D Fish tracks group object |
 |
3D Region Track group object |
 |
3D Regions/3D Region Class object Note: The Unclassified regions Region Class object must be selected for display, otherwise it is not shown. |
 |
3D Polyline group object |
 |
3D Model object |
 |
3D Raster image |
|
Sticky Note icons |
|
 |
Sticky Note |
|
Line icons |
|
 |
Raw line variables (Sounder-detected bottom, raw depth lines, raw heave lines) |
 |
Editable line variables |
 |
Virtual line variables |
|
Variable icons |
|
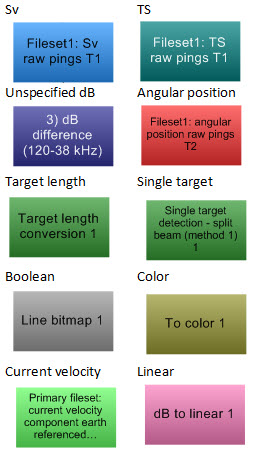 |
Single beam acoustic variables |
|
Bottom points variables |
|
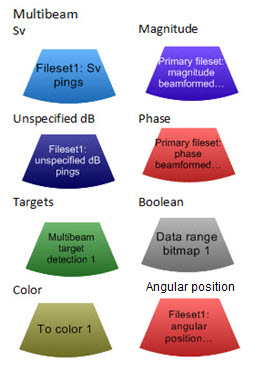 |
Multibeam acoustic variables |
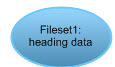 |
Attitude variables (Heading, Roll, Pitch) |
  |
Position variables (Position GPS fixes) Distance variables (Vessel logs) Speed variables |
 |
Length variables |
 |
Video variables |
 |
Image variables |
|
Variable status |
|
 |
Red inner border indicates that the variable uses LocalCal calibration settings. Available colors: Red, No border. |
  |
Collapsed group of variables. The border is specified by the group color. Variables in an Expanded group have a border that is specified by the group color. |
 |
Light gray fill color: Unavailable object |
Notes:
- The color of the shape is specific to the operator group and the intensity of the color is specific to individual operators. This provides a set of visual clues as to the operators in use.
See also
Creating and deleting virtual variables
Dataflow Toolbox
About virtual variables
Operators
Dataflow window keyboard shortcuts